I was able to make graphs and charts based on the data sent by my MV1s to a Google sheet.
Here is a video that shows you how to do it:
How to make graphs and tables based on data
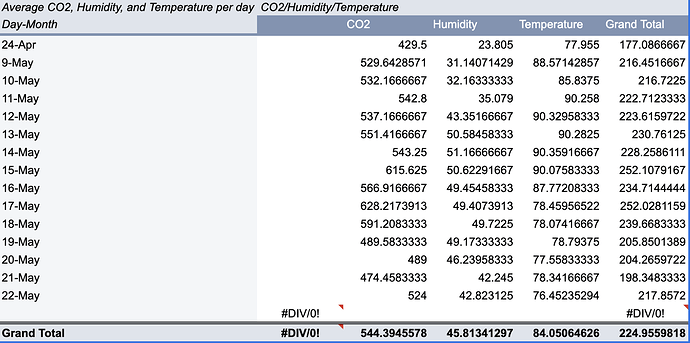
This allowed me to make charts:
*This is a chart showing the average CO2, humidity and temperature per day
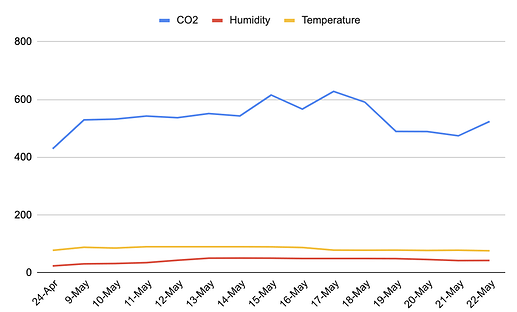
This helped me make graphs based on all of the data :
This is a graph showing CO2, Humidity, and Temperature on average every day
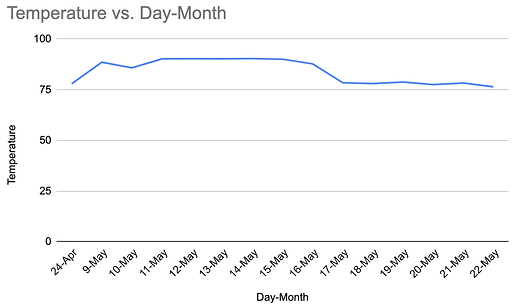
This also helped create graphs on just one set of data:
This is a graph just showing the average temperature each day
By selecting the whole row, as seen in the video, the charts and graphs should update automatically without redoing them.
You can see graphs like this on the MARSfarm software, but this is a good way to use data and manipulate it into different graphs and charts comparing lots of things. I am excited to show you more ways to present and read your data as the trials continue!


