This topic will discuss how a basic knowledge of botany and a bit of research digging through PDFs made by the USDA can be used to determine which crops should be grown in CEA farms.
This Google Drive folder contains several spreadsheets designed to evaluate the pros/cons of particular crops for CEA applications: Plant Research & Lists - Google Drive. I don’t have a clear table of contents built yet so you’ll have to click through them yourself to find what you want - sorry. As I dive back into this information myself, I’ll continue to share examples of particular plants and whether I believe they are well-suited for production in a hydroponic/indoor/climate-controlled environment based on the data accessible here. This data is focused on the HOW of growing specific plants - the conditions required, days to harvest, etc.
I’m assuming here that the goal is to answer the question “which fruits and vegetables that are available in a grocery store now could be potentially grown in a CEA (hydroponics & LEDs) farm within the next 10 years?” - these are all produced at scale and not just popular with home gardeners. I can have a totally different response - all about herbs - if we’re not as focused on the industry.
**The first way to help students select a plant for growing I’d look at is how long a plant takes to harvest.**The chart below shows harvest durations of common crops that could feasibly be grown in a MARSfarm product. This is filtered to only be fruit/vegetable commodity crops that are large enough in scale ($$$) to justify technology investment by the agriculture industry - meaning no herbs. Any of the Orange, Brown, or Purple plants could be grown in your equipment.
Orange bars = Leaves at beginning of vegetative phase.
Blue bars = Roots at the end of the vegetative phase.
Brown bars = Buds/Flowers at the beginning of the reproductive phase.
Green bars = Pods/Seeds at the end of the reproductive phase.
Purple bars = Fruits at the end of the reproductive phase.
Chart of days til harvest, colors indicate the anatomical part of the plant that is commercially harvested.
The second thing to think about is which plants, if produced locally, would be more valuable to the market. In essence, CEA enables farmers to grow any plant, anywhere in the world. So because CEA farms cost more to operate (sunlight is free) the value being given to the existing market must come from somewhere else in the supply chain. Here are a few ideas:
food waste in grocery stores (the spoiled product that is thrown out)
cost of cold storage (on-farm and off-farm)
cost of freight
Millions (in some cases billions!) of dollars are wasted by food retailers. This is only what they grow away at the store and doesn’t include the (much larger figure) of what is thrown away after it sits in your home refrigerator. A kale plant that is 1 day old has a significantly higher value than one that’s a week old - both immediately to the retailer and long-term to consumers as well. In contrast, a cabbage plant (very similar to grow) has a shelf life of 60 days - making the value of having “fresh cabbage” less than that of “fresh kale” or “fresh spinach”.
Chart of days before food spoilage, assuming cold storage conditions (40F)
Fresh Vegetables
Average Shrink 2011-2012
Uneaten Whole Fresh Vegetables
U.S. Retail Food Price
U.S. Retail Food Waste $
Romaine and Leaf Lettuce
20.2%
681,000,000
$ 2.75
$ 1,872,750,000.00
Head lettuce
8.3%
345,000,000
$ 1.84
$ 634,800,000.00
Spinach
18.2%
78,000,000
$ 3.83
$ 298,740,000.00
Tomatoes
15.0%
790,000,000
$ 1.50
$ 1,185,000,000.00
Bell peppers
11.0%
361,130,000
$ 1.72
$ 621,143,600.00
Strawberries
14.2%
322,000,000
$ 4.21
$ 1,355,620,000.00
Table of five examples of crops that I think can be profitably grown in a U.S. CEA facility.
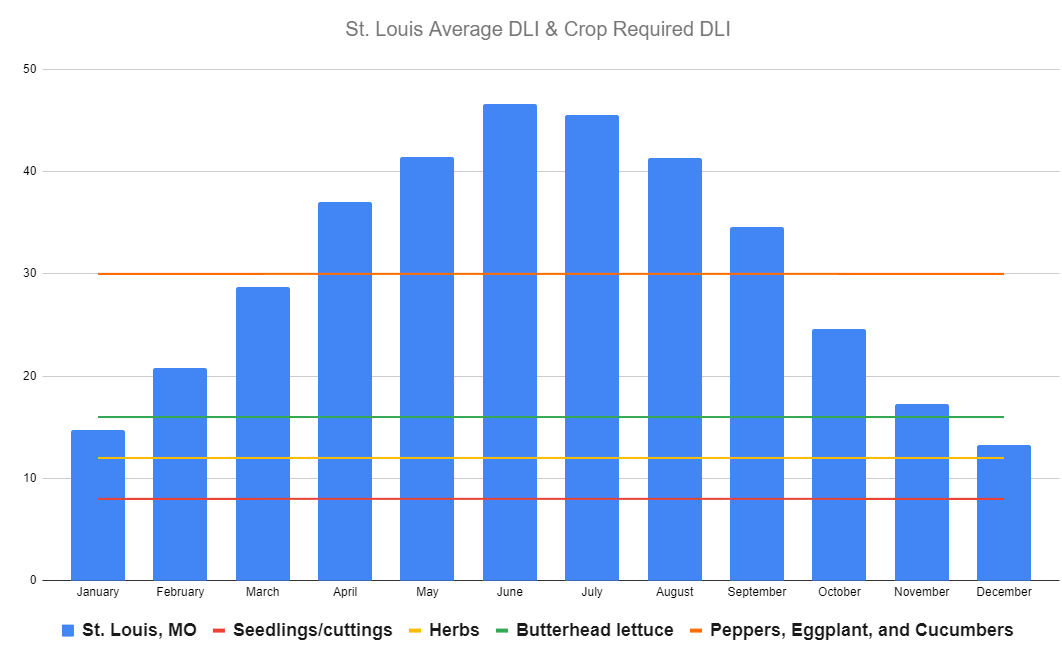
Thirdly, we ask the question - what is the cost of growing this with CEA equipment? The most important variable is the quantity of light a plant requires on a given day. The second most important variable to growth is the hydroponic nutrient solution.
Use the table below to find recommendations for the pH and quantity of nutrients to add.
I recommend that you start with Orange crops - which we eat the leaves of - these will do well in the Deep Water Culture hydroponic systems that came with your MARSfarm Mini Version 0.2 (V0.21 and V0.23) units.
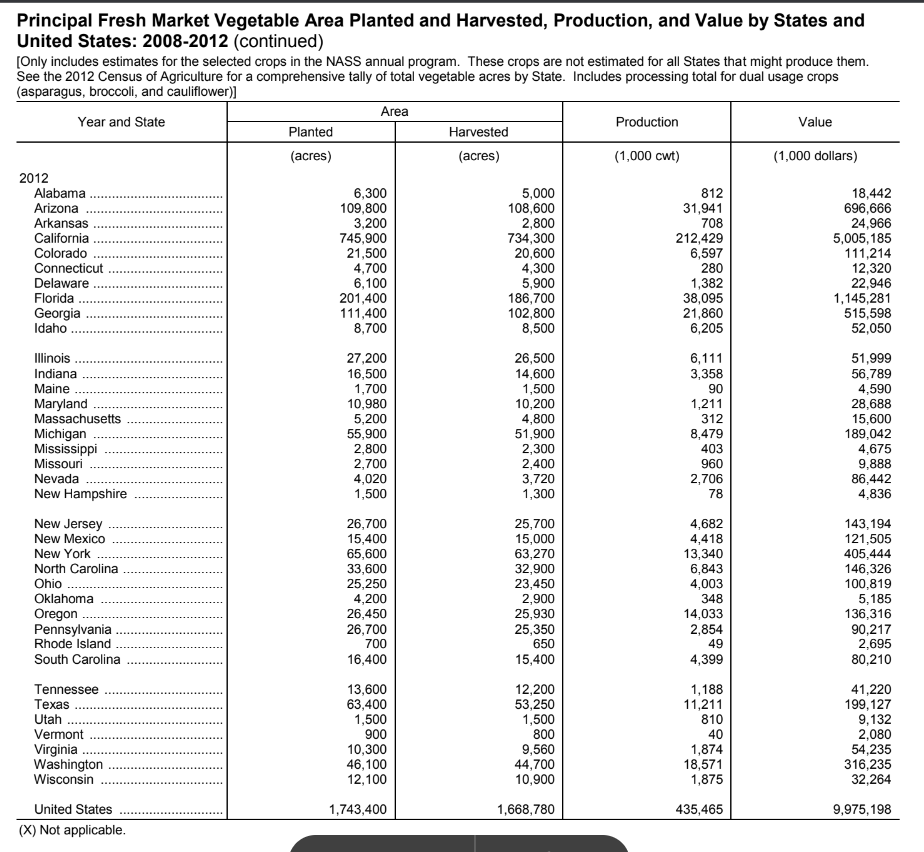
Every few years, a census of farmers is conducted in the United States by the National Association of Agricultural Statistics (NASS) - a subset of the USDA. NASS prepares reports based on the data they collect. These normally focus on commodity crops (corn, soybeans, wheat, etc), however, NASS is also responsible for preparing reports on other “specialty” and “horticultural” crops as well. Unfortunately, the last “Census of Horticultural Specialties” (Specialty crops include vegetables, cut flowers, trees, landscaping, etc.) was conducted in 2014 - so that’s the most recent dataset available. The results of that census were published in this 500-page report.
My favorite report is this Summary of Vegetable Estimates for 2008-2012 which provides detailed data for 20+ key specialty crops by state. Here are two examples of tables included in that report, both of them show the results of the 2012 harvest, the first is grouped by crop, the second is grouped by state:
Please ask questions if you have difficulty searching these reports.
I would love for more teachers and students to be able to use this public data to determine what plants are produced in a specific state, or to discover where their favorite food is grown now - so please don’t hesitate to ask!
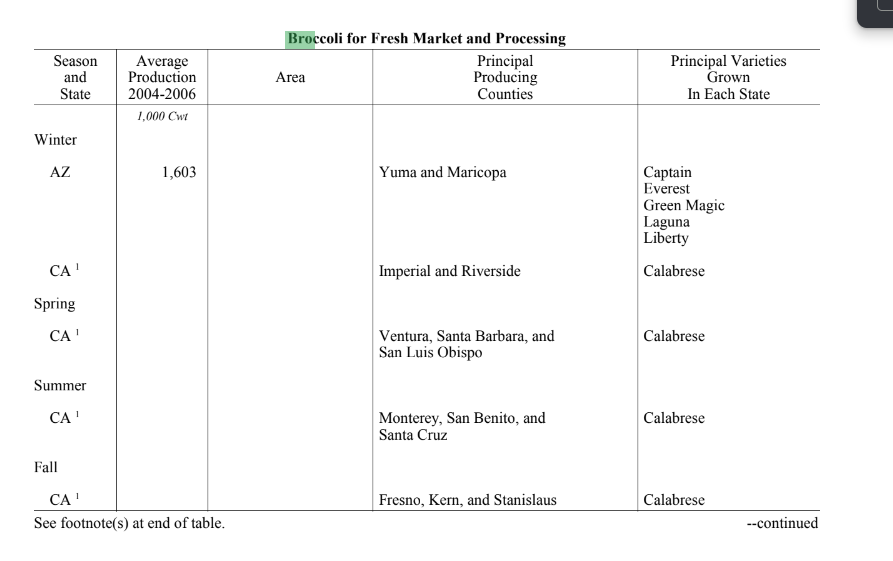
Another cool way to understand what the conditions for a given plant are is to look at the climatology data for where that crop is being grown now. For example, if Yuma and Maricopa county in Arizona are where Brocolli is being grown from August to December, you could look up what the min/max/average temperature was for those months.
Here’s where it gets fun! Now that we know where to look on the maps, we can find data from the government (USDA, NOAA, etc.) about what the climate was during that time. For example, NOAA provides interactive maps for min, max, and average temperatures for all of the United States. I went ahead and filtered this for Arizona, so I could focus on Yuma county and see what the data was there specifically for the period of time when Brocolli is typically being grown.
It does look like though for that big “heading” lettuce (like the “Captain” variety mentioned above, which is what they grow in AZ) it takes 4-6 months and by the time they harvest in February temperatures are as low as 40F.
That being said, they’re still rocking an average of 57F though with highs over 70F - which is super mild for FEBRUARY and is why the plants still are so productive: