The effects of air flow direction on plant growth and water consumption, using two GBE in a side by side test.
Abstract - Two “identical” GBE are used to conduct the same plant trial in parallel, with all conditions the same EXCEPT for the direction of fan air flow. One GBE fan is oriented with air flow downward into the chamber. The other GBE fan is oriented with air flow upward and out of the chamber. Air flow is characterized by direct measurement.
Hypothesis - Expect the downward fan to cause greater evapo-transpiration, resulting in greater water usage and potential differences in plant health and yield.
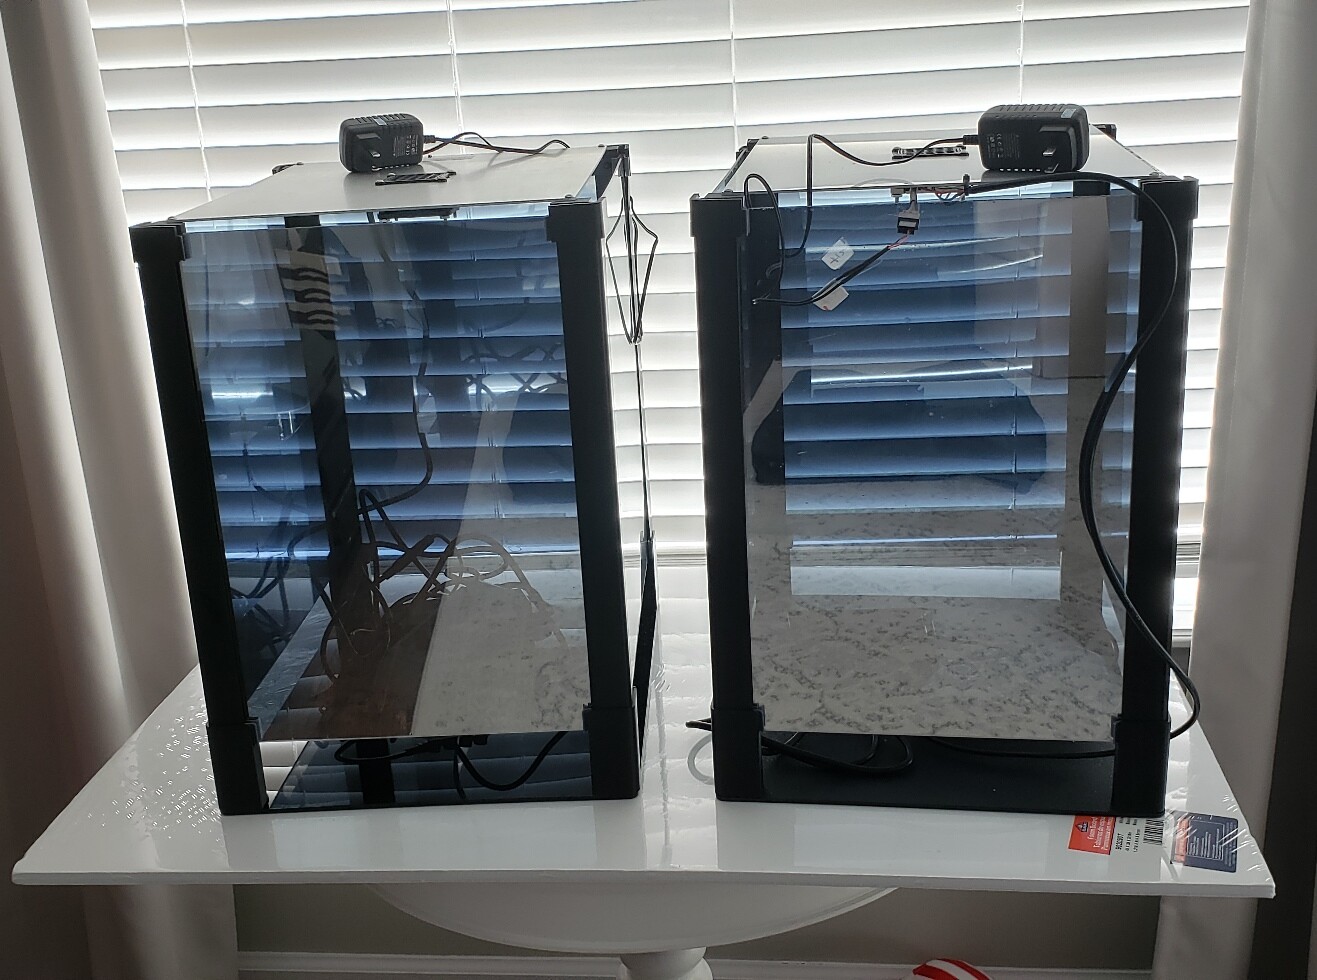
Figure 1 - Initial condition for two GBE units located side by side, prior to characterization of air flow.
This experiment uses two (2) GBE to isolate the effects air flow, while holding all other factors the same through one growth cycle. Initial conditions for both GBE units “out of the box” are shown in Figure 1. Misome has been selected for this experiment.
-Dr Scotty
Dr. Scotty, that’s an interesting experiment! One other interesting thing about the fan is that it has built-in RPM control capability to change the speed. If someone wanted to run an experiment with a different fan speed, could you give some “best practice” tips about how to measure the resulting air speed?
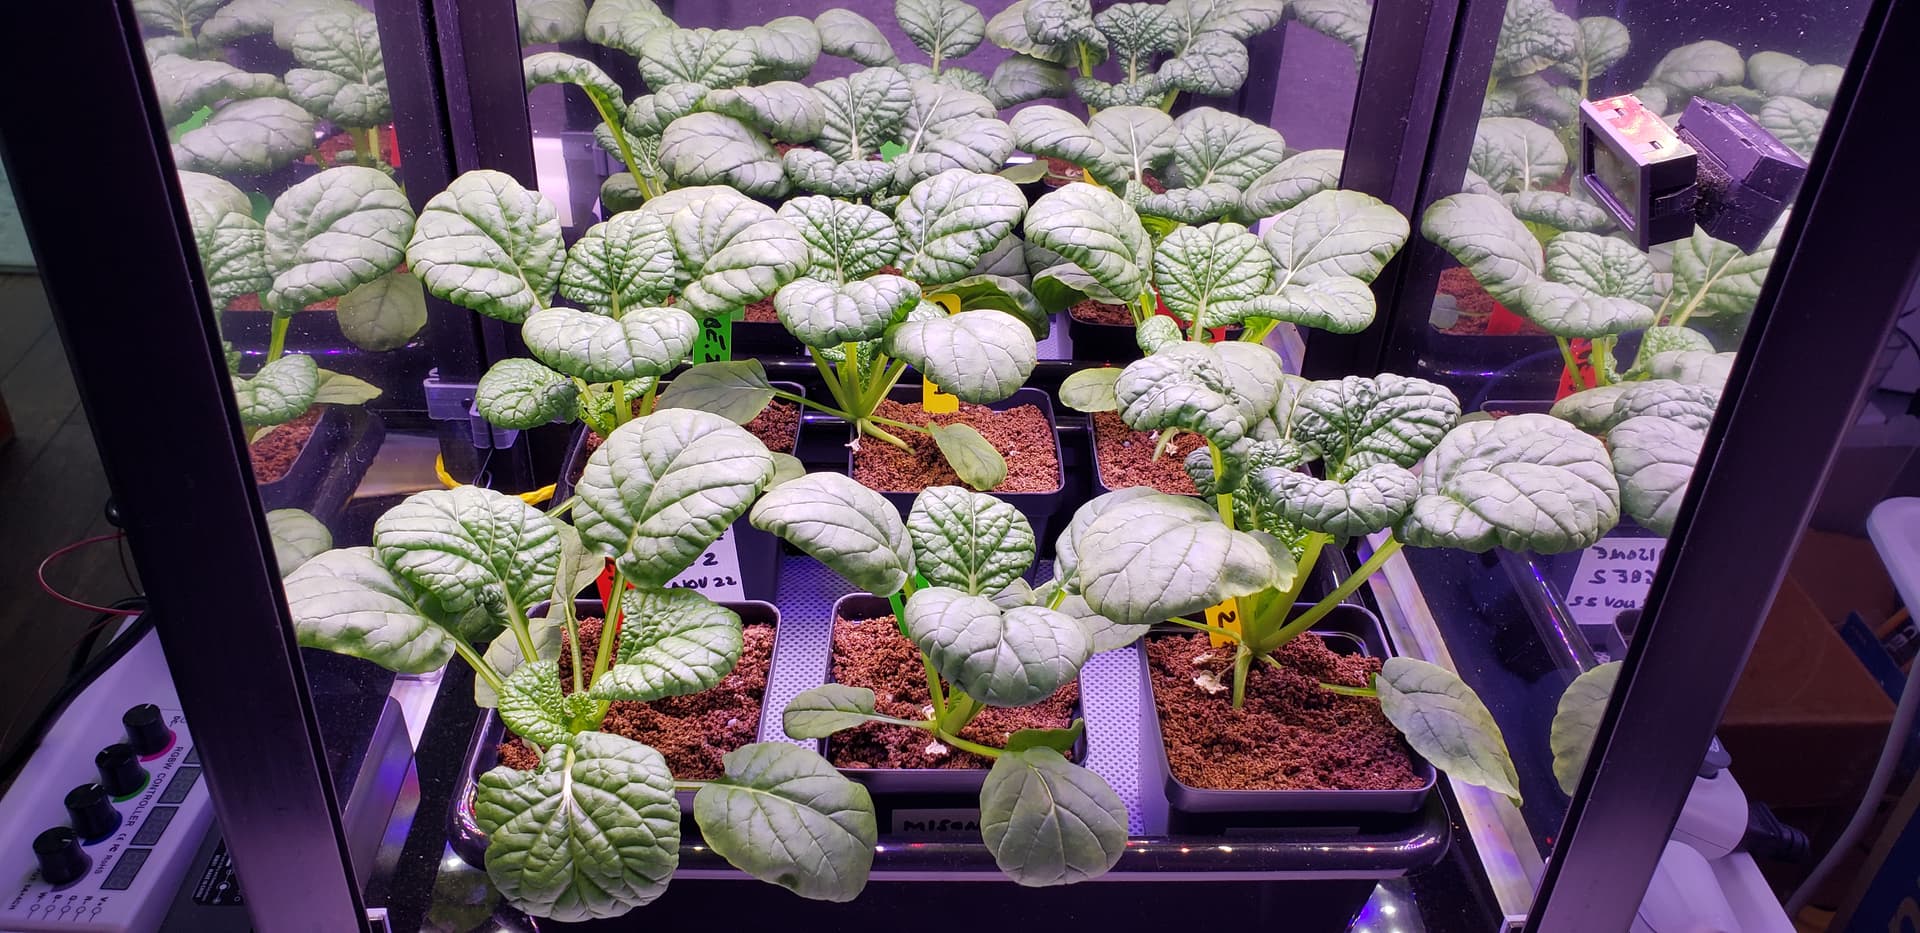
I’m using the moderndevice.com hot wire anemometer for Arduino ($17.95US). It is open source (!) and compares very well to my professional wind sensors. Mapped out air flow pattern for GBE in several configurations. Technical report in preparation and will post in this thread. Here’s a photo of the two systems on Day 8 of the Misome experiment:
Caption: GBE#2 (left) and GBE#1 (right) at Day 8 for Misome, just before culling.
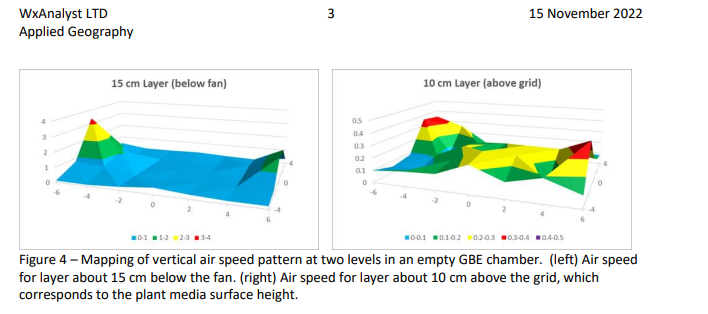
The air flow pattern “fans out” (pun!) and most air flows down the walls. Pointing GBE#2 fan upward like VEGGIE results in near-zero flow inside the chamber. So GBE#2 is pointing downward, but has a relay that cycles the fan every 30 sec (15 sec ON, 15 sec OFF). I’ve already recorded a significant difference in water consumption. (There is a reason to pulse the air flow, rather than set a constant flow rate - more on that later.)
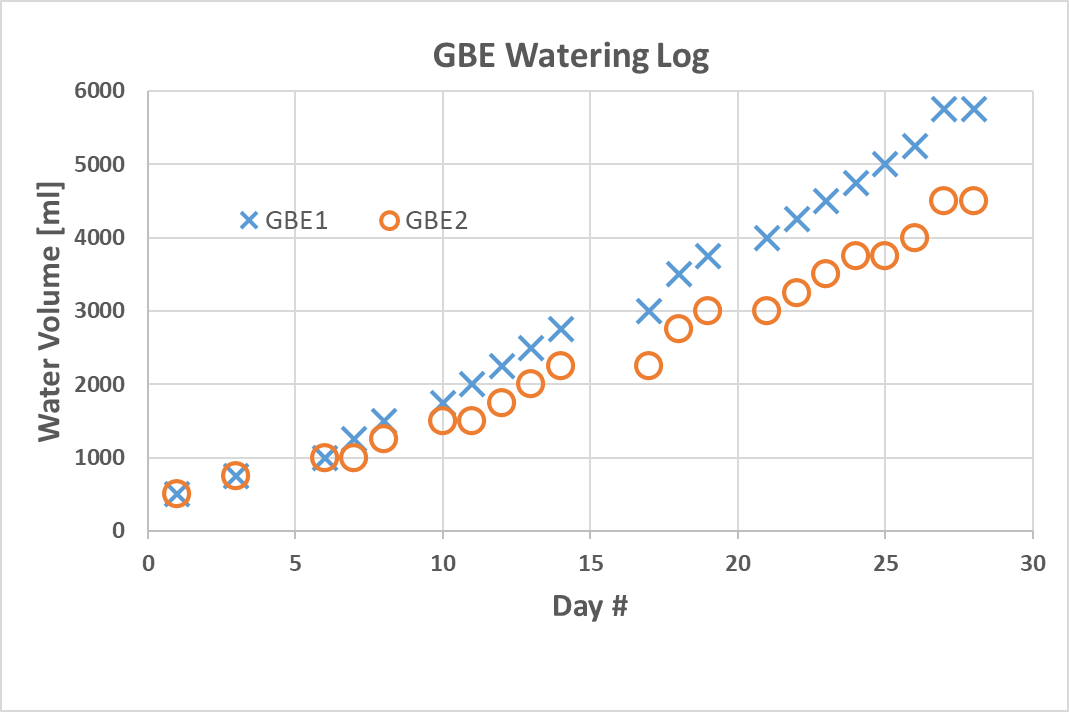
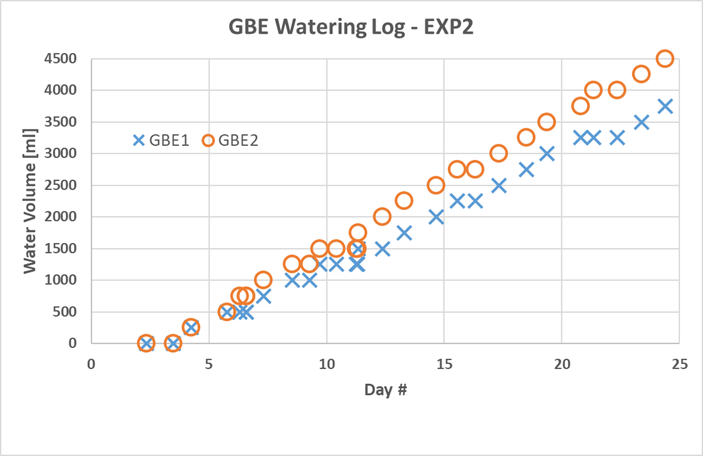
Caption - Final result for water consumption on Day 28. With all other factors the same, GBE2 (fan ON/OFF every 15 sec) has 22% less water use than GBE1 (fan always ON). The Misome in both chambers looks similar (see photos). Although using less water, GBE2 yields 10% more mass than GBE1.
One test result is NOT statistically significant, and there may be subtle differences between the two chambers. One of my chambers is a year old, and neither chamber has been cleaned. The light settings are identical, but actual light output may vary. So if this test is repeated, the chambers should be switched.
Cleaning is also a big deal on the ISS. Does anyone have recommendations on how to clean the GBE chamber surfaces? I’m leaning toward citric acid.
I’m already concerned about the air flow rate within the plant canopy. Natural plant canopies have average internal turbulent flows near 0.2 m/sec. The GBE configuration appears to push air along the walls, and internal canopy flow rates are low. This is an active area of investigation.
You may also want to chart temperature -vs- humidity, or calculate dewpoint and compare these, as dewpoint has an impact on transpiration. In my box (where I track readings every 20 minutes) there is a significant difference between these as things change during day and night.
The exhaust fan also does a trick on humidity (reducing it), and is directly affected by temperature settings and room temperature.
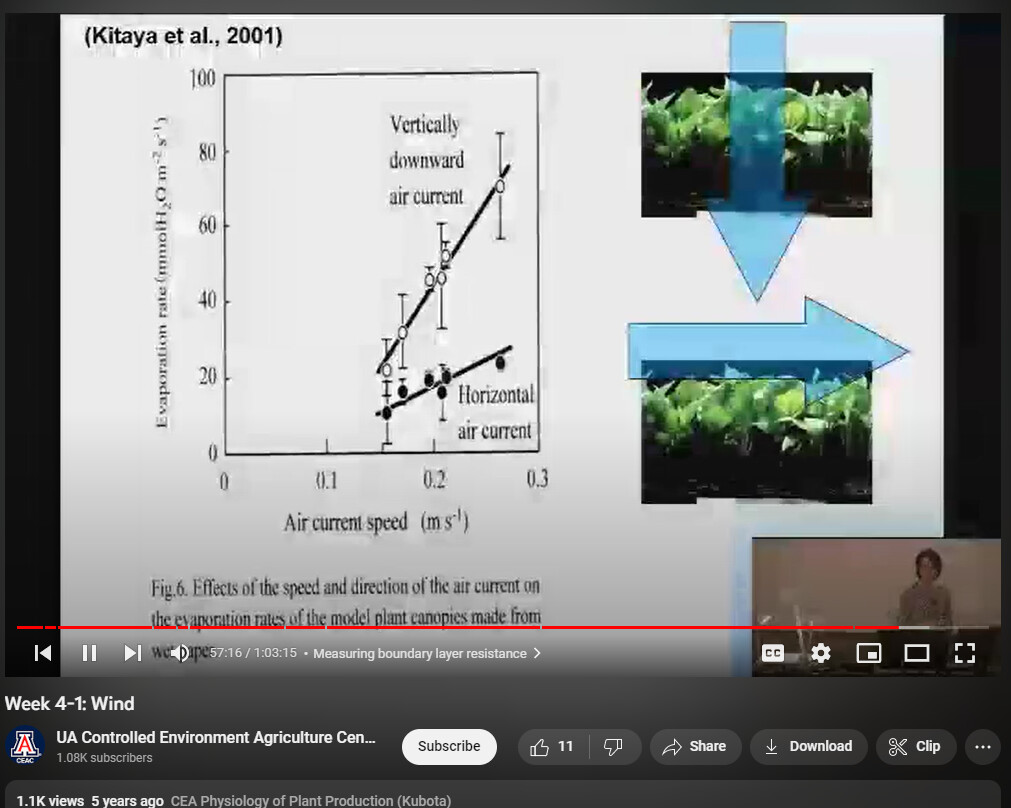
The first time I read this thread I completely missed this link - what gold though! This graph in particular is really interesting (that’s a lot of work!) - I must admit though that I was confused for a moment until I realized that the Y axis was 6-7 times on both charts.
I love this other chart from @wxazygy’s report too! It shows how about half of the airflow is being directed off the bottom of the chamber and back up the sides.
I find it very odd/interesting that the fan is so off-center - I never would have guessed that.
I’d be really curious to see a couple of wind measurements from different spots while you have some larger plants in the chamber. I also wonder if the deeper trays that are being used for GBE this year would help redirect more air upwards. We use a fog machine at MARSfarm to visually observe the airflow of fans, less scientific but lots of fun!
Results for the second test are in. Same experiment but switched chambers. With all other factors the same, GBE1 (fan ON/OFF every 15 sec) has 15% less water use than GBE2 (fan always ON). Although using less water, GBE1 yields 5% more mass than GBE2. Interesting, but still not statistically significant. My tentative conclusion is that the difference in water usage is primarily due to pan evaporation.
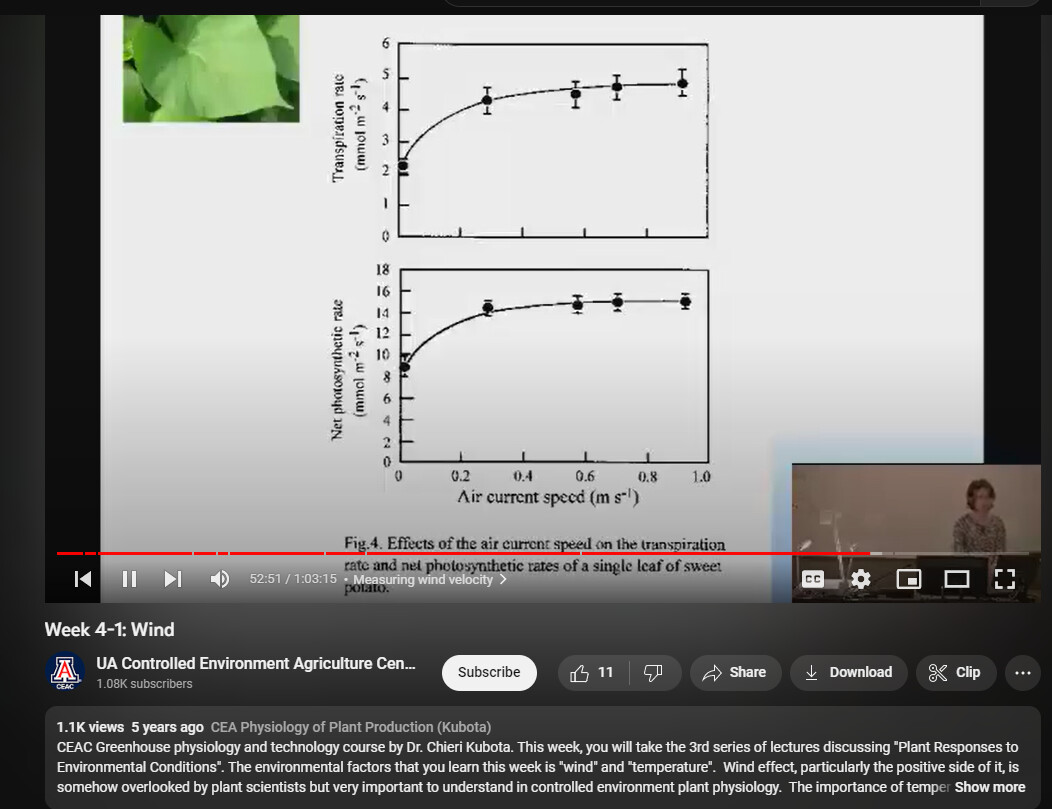
You might be interested in this lecture by Cheri Kubota about wind speed. This is the 6th in a series of 19 lectures she gave as part of a course at the University of Arizona Controlled Environment Agriculture Center. She does a really good job of combining engineering and plant science into this awesome course.
Specifically, right near the end, starting at like 50-60 minutes.
Dr. Kubota shares some recommendations from the industry regarding optimal wind speed in CEA facilities, as well as the impact of directionality. She also covers how to calculate the “boundary layer resistance” / evaporation rate - which you could measure independently after the plants are finished growing to isolate what the plants are using vs what is evaporating. Just an idea!