I don’t have datasets for bok choy, radishes, or lettuce, so I used the datasets I already had to test on the 1.4k images of basil, tomatoes and peas I already have. Here is the source to the code I used:
The mask outputs and data csvs are outputted here:
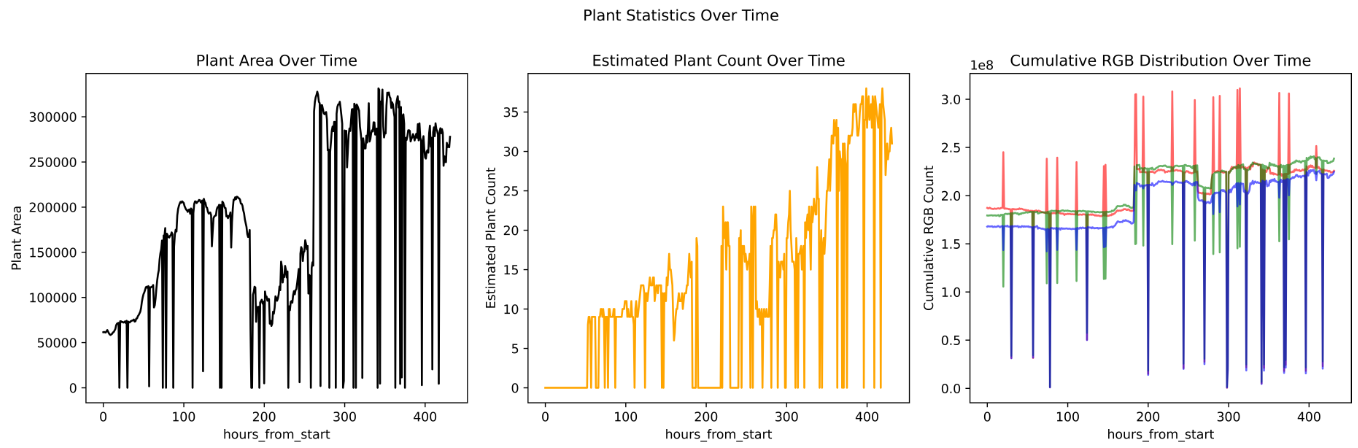
Once above the threshold, the number of plants doesn’t seem to linearly increase. The mask does a fairly good job at broadly detecting what is and isn’t plant pixels and filtering out noise, but the plant pixels aren’t very well contiguously grouped by plant, so it’s a bit imperfect. Perhaps combining all groups into a single area if their roi is under x size could be decently effective? But, it would probably need to be tuned for each type of plant, so an ML model would be needed if we wanted to really get it done well.
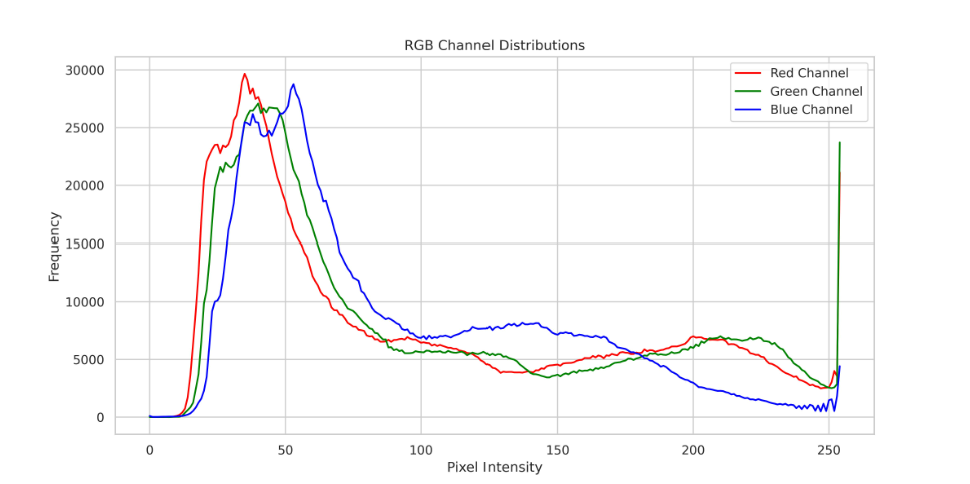
As for the image classification function, would I want to draw a red circle around the region of interest? For the rgb distribution, would it be for the entire image, or just for the selected masked areas? I think that as time goes on, this can get better fleshed out
As requested I also added in plotting functionality to see some of the data being plotted. Since you can’t plot rgb distribution over time for multiple plots, I opted to do cumulative rgb values over time. I’m going to work on generating plots of rgb distribution next. Code is in the same location.