Computer Vision - Using the MV1 to Automatically Measure Plants

Goal: Introduce the topic of Computer Vision.

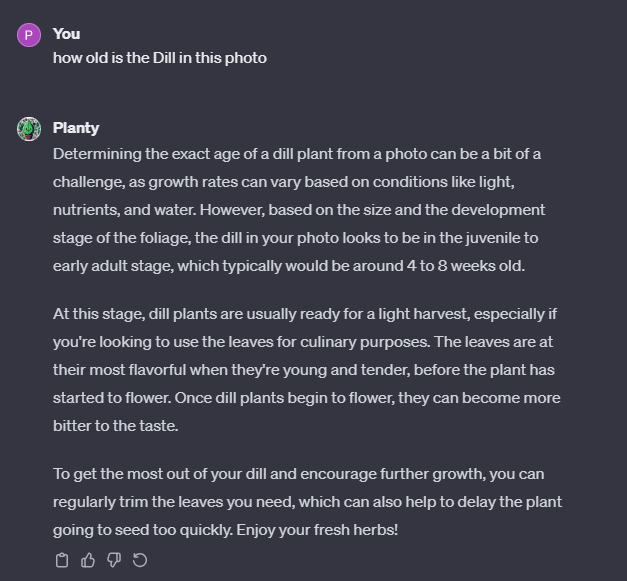
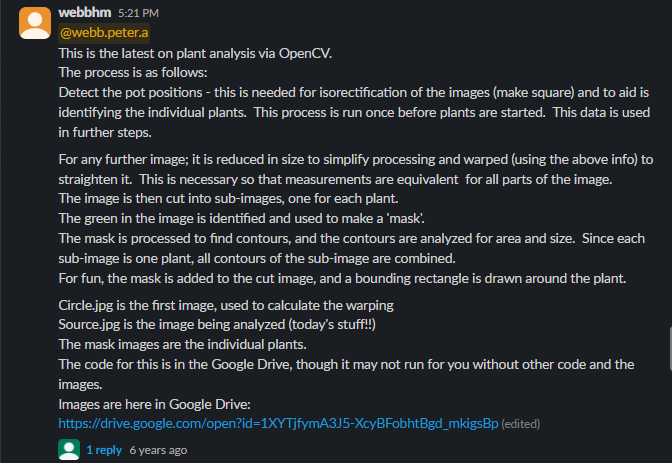
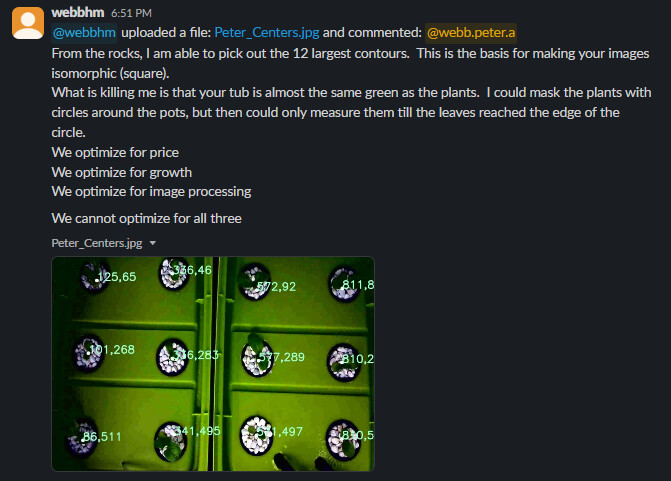
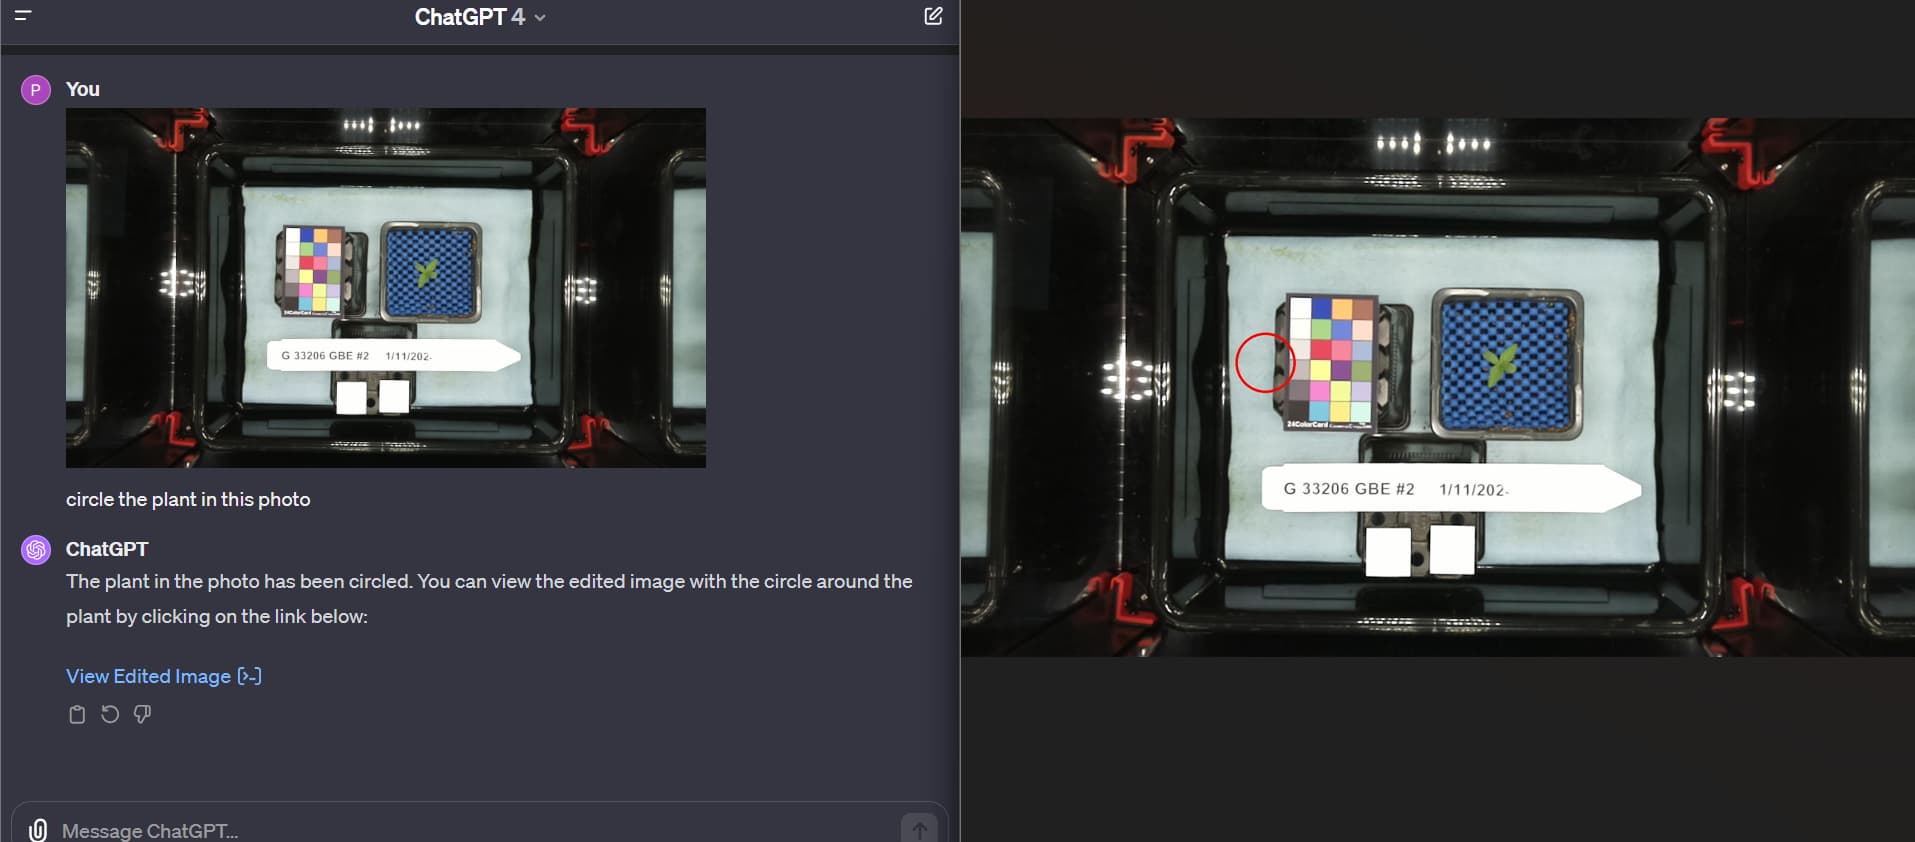
Now that the MV1 exists, it’s time to introduce all of you to the possibilities (so you can introduce your students!) that Computer Vision has to offer. One of our users (@cregini) mentioned that he wants to use OpenCV to extract ‘height, width, depth measurements via still images’ - which I agree is an excellent application of computer vision. It’s also, 100% possible, as you can see in this screenshot:

Before we dive into how @cregini can do this though, let’s start with the hardware and firmware that is necessary to create the image datasets used for computer vision.

Why: The MV1 was designed for computer vision.

Just like a Tesla one day will be able to drive itself, our goal is to integrate computer vision into our software so that your MARSfarm will be able to grow plants better than any human ever could.

  • No image distortion (no fisheye, wide-angle, etc.)
  • Lights flash white (consistent color spectrum and intensity) in every photo.
  • Plants can be separated from their backgrounds (admittedly, this we can improve upon)
  • Top-down position
  • Autofocusing lens
  • 16 MP quality
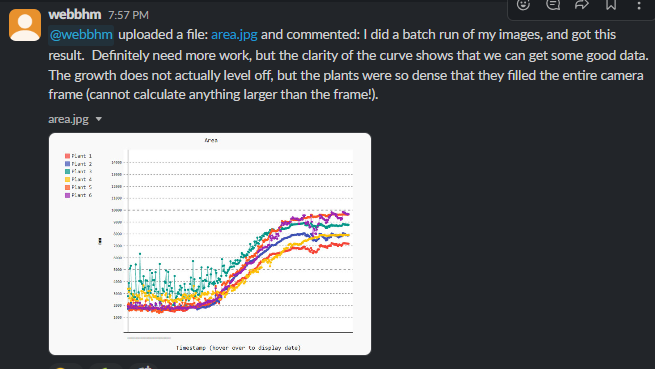
  • Hourly images for calculating growth rates / generating timelapses
  • RGB color spectrum

Definitions: Computer Vision, OpenCV, PlantCV

  1. Computer Vision:
  • Definition: Computer vision is a field of artificial intelligence that enables computers and systems to derive meaningful information from digital images, videos, and other visual inputs, and to act on or make recommendations based on that information.
  • Applications: It is widely used in various applications such as facial recognition, autonomous vehicles, robotic vision, and image processing.
  1. OpenCV (Open Source Computer Vision Library):
  • Definition: OpenCV is an open-source computer vision and machine learning software library. It was built to provide a common infrastructure for computer vision applications and to accelerate the use of machine perception in commercial products.
  • Key Features: It contains more than 2500 optimized algorithms, which includes a comprehensive set of both classic and state-of-the-art computer vision and machine learning algorithms. These algorithms can be used to detect and recognize faces, identify objects, classify human actions in videos, track camera movements, track moving objects, extract 3D models of objects, and much more.
  1. PlantCV (Plant Phenotyping using Computer Vision):
  • Definition: PlantCV is an open-source image analysis software package targeted for plant phenotyping. It is a set of tools and methods that can be used to analyze plant traits using images.
  • Purpose: The main goal of PlantCV is to create a modular, open-source software platform for plant phenotyping. It can be used to analyze both visible light and hyperspectral images, measure various plant traits such as growth, color, and health, and it is useful in agriculture and biology research.

Background/Context: MARSfarm’s experience

I learned a lot about Computer Vision when I quit my ‘real job’ in 2020 to start full-time with MARSfarm. Most of my time in the first few months was spent researching / writing an NSF SBIR grant to develop computer vision software for our greenhouses. The grant would have used an open-source software library called ‘PlantCV’. I picked that software for two reasons: 1) it’s the best in the world for measuring plants 2) the scientists who developed it work Donald Danforth Plant Science Center - the worlds largest plant science research non-profit located here in St. Louis, Missouri. I was able to work with three of their principal investigators to create a plan for them to process a set of images that would be collected using hardware that didn’t exist at the time - but was essentially an MV1.

Takeaways: how not to reinvent the wheel

  1. Hardware - Create an optimal ‘photo booth’ environment. If you have an MV1, that’s ideal, if you don’t then I’ll let @webbhm share some examples of other DIY setups he has used in a later post. I believe @cregini may also be outfitting a GBE GCK with multiple cameras.
  2. Steal the hard work that the scientists who developed PlantCV have already done.
    A. Start by reading this overview of PlantCV
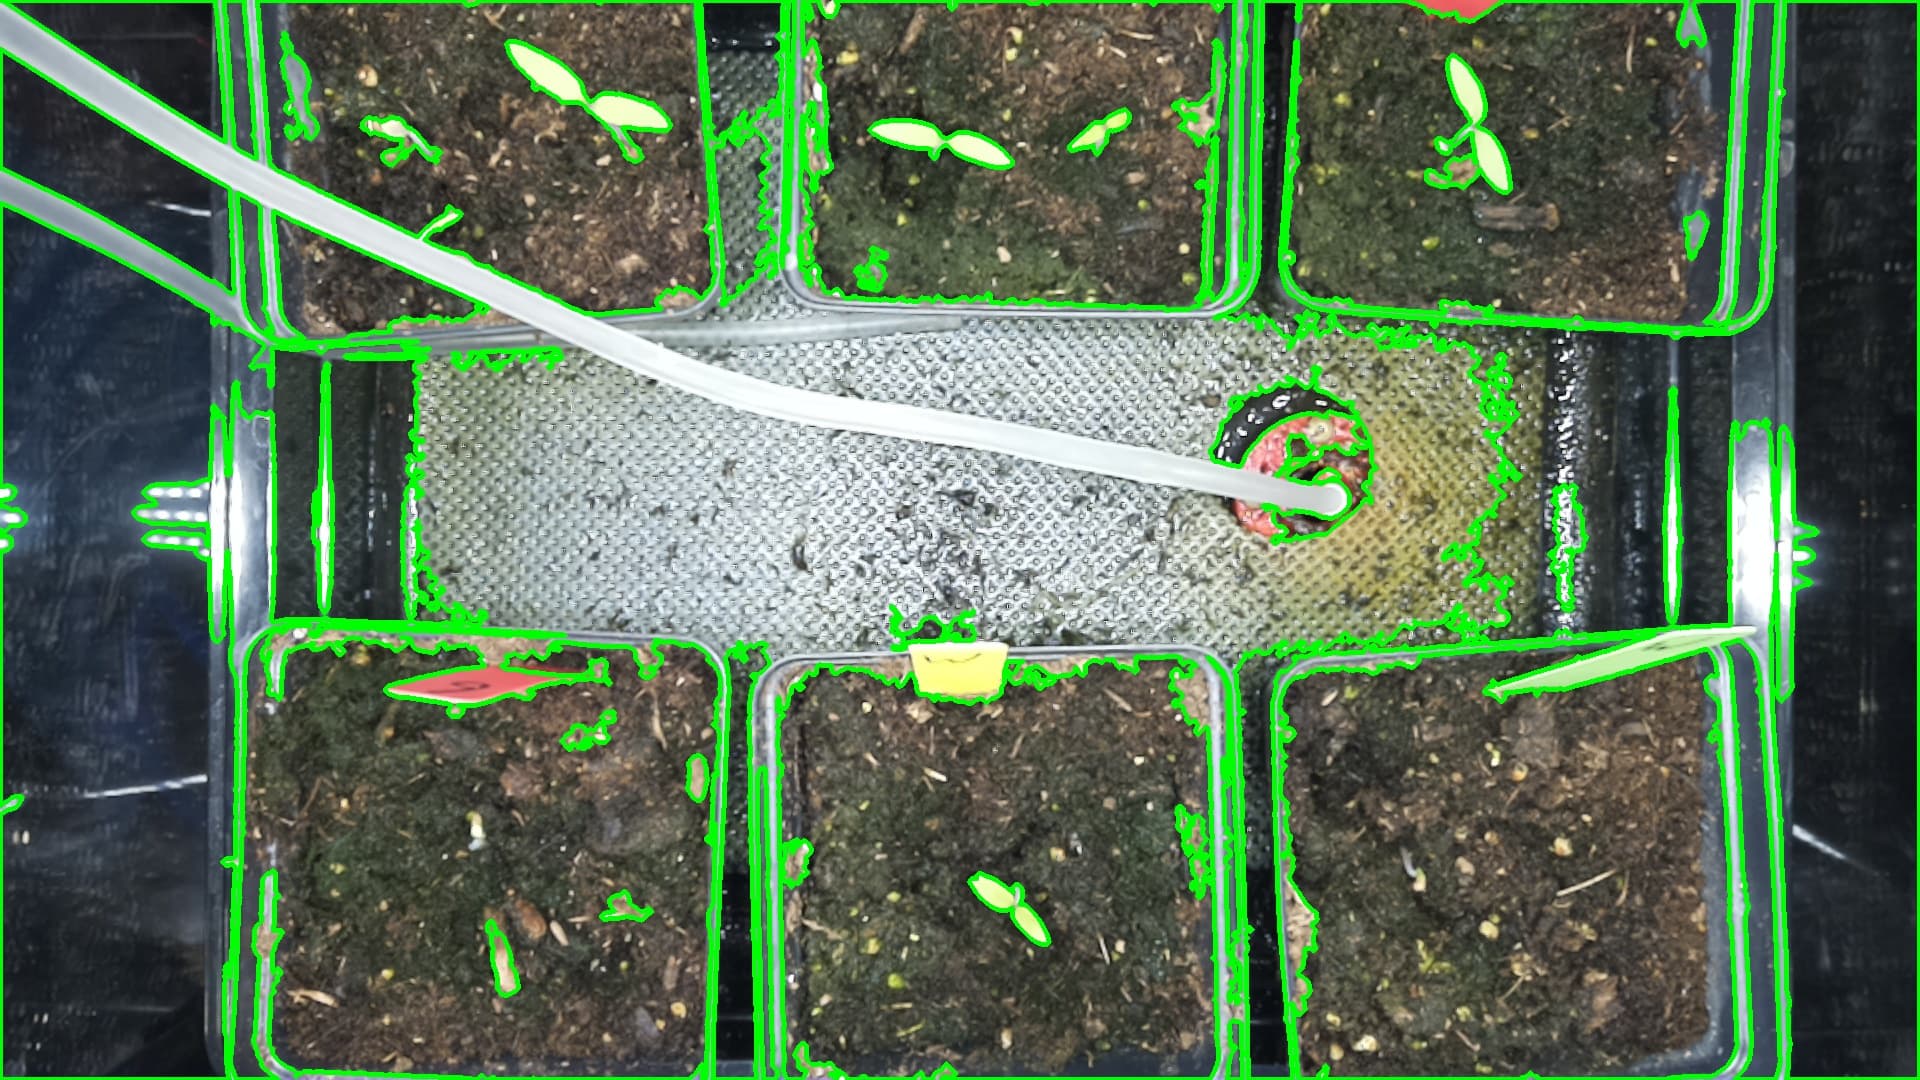
    B. Consider which PlantCV workflow is right for your application. For example, if you’re using the MV1, there are multiple plants in every photo so first these must be separated which makes the Multi-Plant workflow a better choice than Single plant RGB image workflow which assumes a side-view and only 1 plant.
  3. Try to process just one image (a stock image, in a tutorial) rather than using your own. Then once you get it working, you can try it with your images and tune it as necessary.
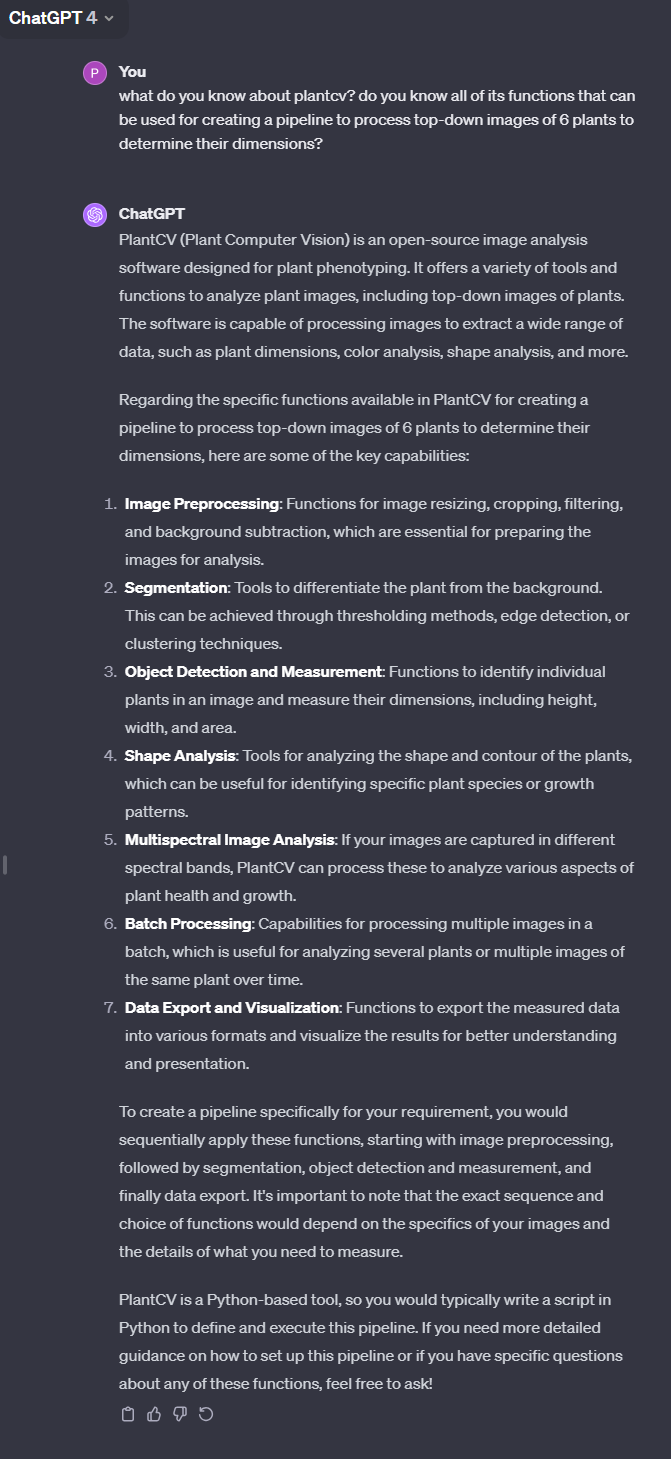
  4. Upload the photo you want to process to ChatGPT premium or Bing and ask what OpenCV functions could be used to measure it. I check that myself once every couple of months just to see what’s new.
1 Like

Wow, so I’ve been using ChatGPT (and Bing, Bard, etc.) to test evaluation of images for awhile now and I have to admit there’s been yet another leap forward.

OpenAI launched the ‘GPT Store’ (arguably the last straw of capitalism that led to the unrest at OpenAI this Fall) and simultaneously OpenAI released a ‘Planty’ GPT (they’ve only had about a dozen public GPTs for the last few months, Planty wasn’t one of them) - which means somebody there is working on this! It’s no suprise, seeing as before the store even launched there were already dozens of Plant Identification GPTs floating around and there’s literally 100s in the App/Play store. That being said, beyond identification and basic plant care tips, they all kind of suck.

Plant Identification

Here’s how it did analyzing a photo of Dill in the MV1, I would share the whole chat but because there are images I’m unable so I’ll just upload screenshots.

For what it’s worth, Bard (Microsoft) and Bing (Google) both fail at this same use case:


Plant Age / Health


Soil Moisture

Then I tried a use case of it analyzing moisture content of growing media, an incredible approximation of the second photo being a ‘6’ and the first being a ‘3’ in terms of wetness.


Plant Age / Health - V2 (multiple photos)

So then I uploaded a series of photos and asked it to analyze all of them to create a summarized story.

This is the power of AI applied to plant phenotyping at it’s most basic level.

Germination Rate

Now I wanted to test the use case of automating the collection of ‘germination rate’ data (calculate the ratio of seeds that germinated, by comparing seedlings to the number of seeds planted) and at first it seems to do a great job.

But when you dig a bit deeper, it becomes clear it’s not actually counting the seedlings and is doing something else - like measuring the ratio of green pixels in quadrants of the photo or something:

A. To be fair, it gets the fact that the bottom right pot does worse than the top left pot.
B. To be critical, there are probably 50+ seedlings in some of those pots initially. So if our goal was to calculate germination rate and I my denominator was the number of seeds I planted (60?) then I’d be getting a germination rate of ~10% from ChatGPT when in reality it was 90%+.

Takeaways

My opinion is that there are still two fundamental problems, which I think MARSfarm could potentially do a better job of solving than even OpenAI. This would only be because of our ability to crowdsource a massive dataset of environmental data and photos using deployed hardware in schools:

  1. When leaves overlap it’s impossible to see the bottom one, making it impossible to measure.
    A. The grant MARSfarm wrote in 2020 tried to use a video processing algorithm called Optical Flow Analysis to project (not measure) the fresh weight of leafy greens at the time of harvest, using the growth rate of a plant. This only works for ‘rosette’ plants (where leaves form in the center and grow outward, like lettuce) but is a way of fundamentally solving this ‘overlapping leaves’ problem.
  1. GPT hallucinates and does a phenomenal job of bullsh**ing a ‘reasonable’ answer but that in reality differs greatly from base reality and has no way to align the former to the later.

Who is Dr. Malia Gehan?

Dr. Malia Gehan works in St. Louis at Danforth Plant Science Center and is the co-creator of PlantCV.

How can I learn about what it’s like to be a plant scientist like Dr. Gehan?

Watch the YouTube video below. She gets into the weeds (lol) of PlantCV is being used in academia in a YouTube video earlier this year which I’ll summarize below. Don’t worry if you don’t understand all of it, the important part is to understand the variety of use cases and ways in which this technology is being applied to solve real-world problems. It’s very impressive to hear how focused they are on finding the right questions to be asking (truly novel) so that their solutions have the maximum impact on the global food system.

Video Summary via ChatGPT

Here’s a summarized outline of Dr. Malia Gehan’s seminar on “Open Challenges in Plant Phenotyping with PlantCV” from the Forestry and Agricultural Biotechnology Institute:

  1. Introduction and Background (0:05 - 1:04)
  • Introduction of Dr. Malia Gehan.
  • Discussion of her work in plant phenotyping and coding.
  • Mention of projects on quinoa, flowers, and heat stress.
  1. Focus of Malia Gehan’s Lab (1:04 - 2:01)
  • Overview of the lab’s focus on crop resilience to temperature stress.
  • Interest in environmental factors affecting crop growth.
  • Research on high and low temperature stresses due to climate change.
  1. Approach to Studying Temperature Stress (2:01 - 3:57)
  • Utilization of natural variation under stress.
  • Challenges in manual phenotyping of large plant populations.
  • Importance of understanding the relationship between stress and time.
  1. High-Throughput Phenotyping Techniques (3:57 - 5:42)
  • Use of non-destructive image-based phenotyping.
  • Description of the high-tech phenotyping facilities at the lab.
  • Implementation of inexpensive camera systems for broader experimentation.
  1. Plant Phenotyping with PlantCV Software (5:42 - 10:07)
  • Introduction to PlantCV software.
  • Emphasis on the flexibility and modularity of PlantCV for various plant species and environmental conditions.
  • Detailed explanation of the software’s functionality and benefits.
  1. PlantCV Development and Community Impact (10:07 - 11:45)
  • Discussion on the open development of PlantCV.
  • Importance of comprehensive documentation for accessibility.
  • Insights into the usage statistics and contributions from the community.
  1. Examples and Applications of PlantCV (11:45 - 12:23)
  • Showcasing various research applications using PlantCV.
  • Examples of PlantCV being used for machine learning and deep learning projects.
  1. Unexpected Applications of PlantCV (20:25 - 21:29)
  • Description of surprising uses of PlantCV in non-plant research, such as analyzing sidewalk cracks and vesicle branching.
  • Emphasis on PlantCV’s versatility and unexpected applications in various fields.
  1. PlantCV as an Educational Tool (21:29 - 22:26)
  • Discussion of using PlantCV for teaching data science and bioinformatics to younger researchers.
  • Illustration of how PlantCV simplifies the teaching process by providing direct applications.
  1. Enabling Low-Cost Phenotyping with PlantCV (22:26 - 24:14)
  • Focus on developing tools for low-cost phenotyping, especially using Raspberry Pi’s.
  • Introduction of machine learning tools like Naive Bayes classification for plant segmentation and disease analysis.
  1. Applications of Naive Bayes Classification (24:14 - 26:28)
  • Demonstration of using Naive Bayes for different purposes such as plant disease severity and stress analysis.
  • Explanation of how this tool offers robustness against lighting variations.
  1. Advancements in PlantCV Thresholding Methods (26:28 - 28:00)
  • Introduction of new thresholding methods in PlantCV for better plant segmentation.
  • Discussion of interactive data annotation tools integrated into PlantCV for easier labeling.
  1. 3D Watershed Algorithm for Plant Segmentation (28:00 - 29:53)
  • Explanation of the 3D watershed algorithm for segmenting plants when they start to touch.
  • Application of this tool across various plant species and its importance in non-destructive plant phenotyping.
  1. Leaf Segmentation and Time Linking with PlantCV (29:53 - 31:38)
  • Use of convolutional neural networks for leaf segmentation.
  • Introduction of a time linking module in PlantCV for tracking individual leaves over time.
  1. Hyperspectral Imaging and Analysis with PlantCV (31:38 - 33:16)
  • Description of hyperspectral imaging capabilities in PlantCV.
  • Collaboration with other open source packages for enhanced hyperspectral analysis.
  1. Vignettes on Hyperspectral Imaging for Disease Detection (33:16 - 36:40)
  • Presentation of a project using hyperspectral imaging for early disease detection in sorghum.
  • Differentiation of diseases with similar visible phenotypes using hyperspectral analysis.
  1. Early Disease Detection and Discrimination with Hyperspectral Imaging (36:40 - 39:53)
  • Exploration of hyperspectral imaging for early disease detection and differentiation in sorghum.
  • Success in distinguishing between two bacterial diseases with similar phenotypes using spectral match filter algorithms.
  1. Interoperability of PlantCV with Other Software Tools (39:53 - 43:00)
  • Emphasis on PlantCV’s compatibility with other open source phenotyping tools and packages.
  • Encouragement for collaboration with developers of open source phenotyping software.
  1. Case Study: Quinoa Under Heat Stress (43:00 - 47:48)
  • Analysis of quinoa’s response to different heat stress conditions using PlantCV.
  • Investigation of yield reduction, flower maturity, and resource allocation under heat stress.
  • Utilization of hyperspectral imaging to screen for specific stress responses in larger quinoa populations.
  1. Final Discussion and Q&A Session (47:48 - 52:29)
  • Q&A session addressing PlantCV’s applications in various fields, including disease imaging and drone data analysis.
  • Discussion about the size of training datasets needed for effective machine learning with PlantCV.

Takeaways

For accurate measurement using RGB imaging, PlantCV is world-class.

  • Deep Learning / Neural Nets make it easier than ever to obtain usable datasets. They’ve improved:
    • RGB cameras
    • Top-down views
    • Color correction

Hi Peter,

Does ChatGPT4’s database have documentation for PlantCV in its system?
Would images from MV1 be normal RGB, or would they be NOIR (near infrared) camera types?

PlantCV certainly seems like quite a powerful tool. What online datasets would you recommend using to learn PlantCV?

Thanks as always

1 Like

It would seem so

Right now we only collect RGB. I know there can be value to NOIR but we can are confident we can accomplish what we want with just RGB.

You can see examples of images and scripts that we used to interact with OpenCV and PlantCV libraries using this Google Drive link: Image Analysis (Computer Vision) - Google Drive

I would recommend trying to use the images provided in the PlantCV documentation first - like this one:

MPI_testimg

Start by separating that 1 image of 18 plants into 18 images of 1 plant. That’s the first step before you would be able to then measure the size of the plant in each of those images. Once you can do both of those steps for this one image, then we can adapt it to work with a larger variety of images. I’ll give you a link to an S3 bucket with 1000s of images you can run that same function on but until then you really don’t need/want more than that one image for what we’re trying to do.

ChatGPT 4 even tried to use PlantCV in but apparently it’s not available in the ‘Code Interpreter’ Python environment.

It did provide this code though:

import cv2
import numpy as np
from plantcv import plantcv as pcv

# Load the image
class options:
    def __init__(self):
        self.image = "/mnt/data/2023-09-27_1305.jpg"
        self.debug = "plot"
        self.writeimg= False 
        self.result = "./plantcv-output.json"
        self.outdir = "." # Store the output in the current directory

# Get options
args = options()

# Set debug to the global parameter 
pcv.params.debug = args.debug

# Read image
img, path, filename = pcv.readimage(filename=args.image)

# Convert RGB to HSV and extract the saturation channel
s = pcv.rgb2gray_hsv(rgb_img=img, channel='s')

# Threshold the saturation image
s_thresh = pcv.threshold.binary(gray_img=s, threshold=85, max_value=255, object_type='dark')

# Median Blur
s_mblur = pcv.median_blur(gray_img=s_thresh, ksize=5)
s_cnt = pcv.median_blur(gray_img=s_thresh, ksize=5)

# Find objects
id_objects, obj_hierarchy = pcv.find_objects(img=img, mask=s_cnt)

# Define region of interest (ROI)
roi1, roi_hierarchy= pcv.roi.rectangle(img=img, x=100, y=100, h=200, w=200)

# Decide which objects to keep
roi_objects, hierarchy, kept_mask, obj_area = pcv.roi_objects(img=img, roi_contour=roi1, 
                                                              roi_hierarchy=roi_hierarchy,
                                                              object_contour=id_objects, 
                                                              obj_hierarchy=obj_hierarchy,
                                                              roi_type='partial')

# Object combine kept objects
obj, mask = pcv.object_composition(img=img, contours=roi_objects, hierarchy=hierarchy)

# Find shape properties, output shape image (optional)
shape_img = pcv.analyze_object(img=img, obj=obj, mask=mask)

# Output shape data
#pcv.print_results(filename=args.result)

# The output filepath
output_image_filepath = "/mnt/data/shape_img.jpg"

# Save the output
cv2.imwrite(output_image_filepath, shape_img)

output_image_filepath

I tried to then have ChatGPT use OpenCV to process the image instead (because it CAN use that) and got this resulting image. I would say it’s doing a good job of finding the unique objects but not isolating the plants from everything else.

Here’s the photo that ChatGPT generated and the code it ran using OpenCV to generate this image:

import cv2
import numpy as np

# Load the image from file
file_path = '/mnt/data/2023-09-27_1305.jpg'
original_image = cv2.imread(file_path)

# Convert to grayscale
gray_image = cv2.cvtColor(original_image, cv2.COLOR_BGR2GRAY)

# Apply Gaussian blur to remove noise
blurred_image = cv2.GaussianBlur(gray_image, (5, 5), 0)

# Threshold the image to get the plants in the foreground
# We use Otsu's thresholding method which automatically determines the best threshold value
ret, thresh_image = cv2.threshold(blurred_image, 0, 255, cv2.THRESH_BINARY_INV + cv2.THRESH_OTSU)

# Find contours from the thresholded image
contours, hierarchy = cv2.findContours(thresh_image, cv2.RETR_TREE, cv2.CHAIN_APPROX_SIMPLE)

# Filter out small contours that are not plants
min_contour_area = 500  # this threshold depends on the size of the plants in the image
large_contours = [cnt for cnt in contours if cv2.contourArea(cnt) > min_contour_area]

# Draw contours on the original image (for visualization)
contour_image = original_image.copy()
cv2.drawContours(contour_image, large_contours, -1, (0, 255, 0), 3)

# Calculate and print the area of each contour (plant)
for i, contour in enumerate(large_contours):
    area = cv2.contourArea(contour)
    print(f"Contour #{i+1} area: {area}")

# Save the output image
output_file_path = '/mnt/data/contoured_plants.jpg'
cv2.imwrite(output_file_path, contour_image)

output_file_path

Bottom line:

  • ChatGPT can write PlantCV code
  • ChatGPT can write AND RUN OpenCV code

I see. Are you running these programs locally, or are you using a cloud service to run these workflows, say google colab or aws sagemaker? I am currently running locally on my machine using a mamba environment in wsl for the packages.

opencv needed libgl1-mesa-glx to work (which needed apt), so I decided to use Docker instead.

I got part of the program to run, but it was stuck on the find_objects method, which was available in V2 but not in newer versions

1 Like

Two things to remember in managing your expectations of OpenCV:

  1. The MV1 was designed as a plant growth chamber, not a photo-booth.
  2. The more you clean-up your subject, the fewer issues you have to deal with in OpenCV.
    One of my previous employers did a lot with imagery. They had a conveyer belt that moved the individual plants into a special photo-booth with diffuse lighting, neutral grey walls and multiple cameras.
    The MV1 has highly reflective walls, and the lighting is normally set for an experiment (I modified the code of my test box to change the lights to a standard setting when taking images).
    There are several things that can be done to simplify the code problems:
    a) Use OpenCV’s approach of putting neutral ‘collars’ around the plants to have a consistent background.
    b) Always put the plants in the same location, and avoid hoses and stray items in the image.
    c) With standard locations, you can deterministically slice the image into separate plant images, and process them one at a time as individual plants.
    d) Put a color-card (you can make your own) in the box so you can adjust your colors to a consistent reference.
    e) Know your strategy: are you starting with edge detection, or color masking?

I found this worked well to count leaves, and measure width and depth - until the plants got big enough to start growing into each other!

1 Like

oops - didn’t see your question sooner, sorry @ajc3xc. FYI - if you tag me on any questions (@Peter) I’ll do my best to get back quickly.

Honestly, that’s a great question. The testing we did above was done entirely locally, just on a windows laptop. However, I know that PlantCV recommends using Jupyter Notebooks and I can see the advantage when you get into larger datasets of running things remotely.

I’m not very familiar with either of the tools that you mentioned and would be very interested to hear about how you would use them to run the workflows - as opposed to doing it locally.

Could you clarify why this caused you to move to Docker? I guess I’m a little confused about what script you’re trying to execute that is causing you to install these libraries.

@Peter If I’m not wrong, I think it was opencv, possibly plantcv.

@hmw has MV1-??? (literally the first prototype MV1 we ever made) and a firmware update was made before any production units were shipped so that the lights flash white before taking a photo.

@Surendra @susurujdeomaharaj is working on these modifications to the MV1 with his students!


I found this old post by @hmw in the MARSfarm Slack in 2020 - very relevant

For context, @hmw is a retired Data Architect from Monsanto and is happy to answer questions about his experiences with OpenCV/PlantCV! @ajc3xc @Surendra @cregini

There are three (or four) main Python libraries that are used for camera/image processing. While there is overlap between them, there are significant differences in purpose and features that need to be understood.

PiCamera
This is camera software, particularly software to manipulate the Pi Camera. It is the only package that allows for low level control of the camera settings. While there are settings for cropping, size, rotation, etc; these affect the camera and cannot be independently applied to an image. It has a good preview mode, but the preview is directly sent to the Raspberry Pi HDMI port, so if you are using VNC or do not have anything plugged into the HDMI port, you cannot see the image on your screen.
There are basic functions for saving images and video to files and streams, but note that these are functions of the camera (not the image).
A good aspect of PiCamera is that the image is a numpy array, and can easily be passed off directly to other image libraries without conversion problems.

PIL (Python Image Library)
This is a basic python library for image manipulation. While it can directly access the Pi Camera to get an image, it cannot control the camera. It is for image manipulation, with little video support. PIL does not directly display images, but saves an image as PNG and then calls another Unix application that handles the display.
Because it has only basic image manipulation, I have found little use for it. I can either work directly with PiCamera, or I go to OpenCV.
At this time MVP is using PIL for the image to GIF conversion, though this could also be done with OpenCV.

OpenCV
OpenCV is a python library for computer vision work. I use it for most of my work, especially paired up with PiCamera. It is good for images and video, but like PIL it does not do much with the camera, other than get an image from it. Anything you need from PIL you can do with OpenCV, and a lot more. Much of the library is designed for specialized array manipulation (edge detection, motion tracking) which is built on top of the basic functions.
The down side of OpenCV is the installation. There is a pip image that can be installed, but some needed dependencies do not get automatically installed, and there is at least one proprietary library that requires a pre-load when using OpenCV with Thonny or calling a python file directly. It is not a big issue, but a definite stumbling block for people who are new to the linux environment and python. Building it from source is a challenge. Delivering an image to users gets around a lot of this install stuff.

PlantCV
If OpenCV is a set of electronic chips, PlantCV is a set of circuit boards with chips and standard plugs already installed. While you can do quick and dirty electronic projects by soldering up chips, it is not easy to make changes or regularly reconfigure the hardware. PlantCV wrappers OpenCV in a workflow structure that makes it easy to design and modify processes (even dynamically). There is a definite learning curve and extra work, but it is worth it for large projects. So far I have not gotten to that point.
For now I think you can get by with just PiCamera, since the only thing you are doing is capturing images. Your main requirement is to be able to manipulate the camera focus and possibly some other attributes

Other experiments run by @hmw that were shared to an old Slack channel:


image
image

image
image

@Peter Sorry, good catch.
It is my problem that I am running three different systems, most with prototype hardware and all with very custom software modifications.
On the good side, most of these have been running continuously, literally for years, with no issues.

1 Like

@Peter I’ve been continuing to experiment with plantcv to split up the images, and I’ve had immense difficulties trying to get the right environment setup, namely because a bunch of functions were deprecated in v4 and v3 has serious bugs in imports that weren’t fixed until v4. After a bunch of experimenting, I finally got an environment to work, but some of the stuff that chatgpt says to do for the code is completely wrong, and worse yet was only working with v3 when I specifically asked it to use v4. Hopefully I can figure out how to split these images somehow.

1 Like

That’s dissapointing that it was so difficult for you - sorry to hear that their documentation wasn’t more helpful/straightforward. I believe that @Surendra and @cregini have also struggled to get a working environment in PlantCV recently so rest assured you aren’t alone. Good job persevering!

  1. Are you still trying to work through this tutorial?
  1. So you said you do have it working now, right? What did you have to do to make that happen?
  2. Don’t be afraid to pivot away from PlantCV into OpenCV if you hit a complete dead end.
    • I want you to get to the ‘fun’ part of this sooner rather than later, which would be creating annotated/masked images using python scripts.
    • There are dozens of projects on GitHub where people have taken cv2 and created their own project to calibrate/isolate seedlings using OpenCV so it’s possible to do it that way as well.
    • Another way to approach this is to process a series of images (video) rather than an individual image. We have the unique ability to collect images of the plants where we know (most of the time) the plant hasn’t been moved. That means we can isolate it as an object by looking for the differences between those photos - here’s a paper discussing a similar method to count germination rate of seedlings and my earlier posts on optical flow analysis also build upon this same concept.
  3. @Surendra has modified his MV1 already to make it more ‘friendly’ for extraction of the plants from its background (see the blue mesh below) - it may be easier to try and use this image if you aren’t able to isolate the seedling from the growing media in the previous examples.

Good looking setup.
I have not done much with OpenCV (or PlantCV) in a while, basically because of the issues you came across - you get some decent code working and then the libraries change and it is a pain to try and rebuild.

1 Like

@Peter
I do have a working environment, but I haven’t completed separating the images into different images and save them to their own files. I will see if I can work on separating the test images into separate images.

Would you know how I could modify this so I could save these to separate images? Multi-Plant Workflow

Do you know where I could get the link for the S3 bucket to access the images? Is it publicly accessible, or is it currently private?

Me and a team of students at my university are interested in tackling this problem, so hopefully there should be more hands on deck to try and solve this. Would most of the images be single plants, or multi plant images?

In terms of developing, would plant identification, plant health, germination rate and plant count be relevant things we are trying to research? What would be the greatest weaknesses in openai’s model that we should work on trying to address?

Thanks as always.

1 Like

I was able to develop a prototypical way of separating out the plants in the images. Some of them are a bit cropped, so it may need some work in the future to refine the model.

Here is a link to the workflow I made, which I created by modifying the arabidopsis workflow.

  1. Based on your more recent post, it looks like you were successful in figuring out how to use that workflow - is that correct?

  2. Do you know where I could get the link for the S3 bucket to access the images? Is it publicly accessible, or is it currently private?

I just set you up to have access to our web application so you can download images for yourself from some trials. It’s better to pick different photos from between trials (different plants, different pot placements, etc.) so that you have an understanding of the variation that we need to account for.

Here’s a link to login to the dev site for the web app, where you can download photos from loads of trials:

Once you login, select the ‘Summer 2023 - Demo Experiment’ from the experiments dropdown.

Then click the menu in the top right to see a list of trials in that experiment.

For example ‘Spring 2023 (MV1-0041), Blackseeded Simpson, Bok Choy Recipe’ has like 145 days of photos - including peas, bok choy, basil, tomatoes, etc.

  1. As you can see, most images will contain multiple plants. Our goal is to create a pipeline that will isolate the plants and then measure them. PlantCV takes the approach of first ensuring that every image only contains one plant - this allows them to then load those images into more generic pipelines for measurement. Our photos right now contain a bunch of data that shouldn’t be measured when it comes time to calculate plant size/health. What we have is an array of plants (and pots, and walls, and media, etc.) and so our first step must be to remove those and isolate the plants. Then (and only then) are we able to process those images to extract data about the plants themselves.
  1. ChatGPT is very good at identification and plant health. It seems to struggle with images that contain multiple plants (no surprise) and cannot isolate them from the rest of the photo in order to count them. The germination rate is calculated using plant count and a separately recorded metric of ‘seeds planted’ so really this requires plant count to be done first. It would be worth experimenting with using the ChatGPT interface to measure objects in a photo using OpenCV. For example, if you told it the exact size of the tray (or the pot) could it then determine the size of a leaf? I haven’t tested this myself but if it’s good at using a ruler to estimate the size of other objects - the same methods may apply to plants. I will say though, that it still gives some pretty dumb responses:
  1. Do you know why this cropping is occurring? I’m also still not very clear on how you’re executing this code. Would you please have your team add a ReadMe this week to the repo? It would be very helpful to have instructions on how to run the code locally so I can see what you’ve done to get it working.
  1. So the files in the output are the ones you generated? Why is it that they still contain the background? From what I can tell it still looks like a mask is being applied in the process so I would have thought that to be removed. Also, do you know if the section of the code that determines a ‘Region of Interest’ is functional? Did you have to do anything to get that to work?

  2. Next Steps - Run the same script on the photo I shared above and several others that you sample from the web app. I am sure the results won’t be very good but I’m interested to see what is throwing it off. For example, if the pots being inconsistently placed is a serious problem - we may need to modify the tray to prevent them from moving or something.

Hi Peter,

I went online to the site on both chrome and firefox and wasn’t able to find the trials data. I was able to login using my ajc3xc@umsystem.edu email. This was the screen I got when I logged in.


This is the screen I got when I clicked on the trials button:

When I tried to refresh, it took me back to https://mv1-dev.herokuapp.com/
All the other tabs I clicked onto besides data analysis gave me this image:

When I clicked on data analysis, it took me here, but all of the buttons below seemed to be null, and the view single trial took me back to the screen above.

I found this tutorial on plantcv that deals more with what we’re looking for, since it deals with overlapping plants and actually saves them to a file in the tutorial.

Previously, I was just seperating the plant labels using values in numpy arrays and saving them to a file. Basically, I generated the labels, got the min and max x and y values of each label to calculate the bounds, and then saved the parts of the images within the bounds to a file. It was very hacky, and since the labeled mask didn’t cover the entire plant, some of the plant was cropped out.

The tutorial code for arabidopsis was using manual filtering and labelling of regions of interest, so I did some exploration into automating these processes.

Plantcv seems to have automatic thresholding methods built in, so using a binary threshold should no longer be necessary.

I figured out how to automatically generate ROIs using a rudimentary mean of min and max x and y coordinates instead of using a pre-set grid system of x rows and y cols, but after doing some testing I still don’t know how to use these ROIs to separate images better than using a plain filter alone.

This is the current workflow I was working on

An important thing to note is that the create_labels function can work fine enough without rois when the plants are seperated. I still need to do more research on what the time series workflow is doing. I would like to see if generating labels using the rois will be better than just using the filtered mask. (i.e. pcv.create_labels).

I’m going to keep looking at the other stuff and continue to update this post or add more as I work on it.

1 Like