Also, do you know if the data has labels for it? Say healthy or unhealthy, plant age, plant species, number of plants etc? Since it would be important info for a ML model, if you have that info on hand or know how we could obtain it for the dataset you provided, that would be extremely helpful.
1 Like
Oops, this is a bug - you were somehow able to login to dev despite not actually having an organization assigned to your domain. I set it up to recognize ‘@mst’ rather than ‘umsystem’ - I just updated it though so please try to login again.
Great job with your last post - much more detailed and therefore easier for me to provide feedback.
To label or not to label, that is the question
No, but seriously, I don’t know the right answer here. I believe that it’s possible to create a model that will be able to provide an estimated plant size, without every image being labeled. However, I do think that many of the PlantCV pipelines include/require labeling of the images - especially when multiple plants are in the same photo.
I just updated it though so please try to login again.
I was able to successfully able to log in, so that problem should be resolved. Could you add hjcqcz@umsystem.edu and srk5cv@umsystem.edu?
Would there be certain trials or species of plants you would recommend for initial testing? I’m trying to narrow it down so I can process the data in bite-sized chunks. I am able to download the recipe files as jsons, but I don’t think the data is useful for the work that we’re trying to do. Do you know what the different recipes mean and how they relate to the trials?
I think I figured out how to switch among the different trials by hitting on the triple dashes button on the right.

I’m looking at some of the different trials, and I’m noticing that in some of the trials, the growth of multiple species is put in the same trial, some have empty containers, and others are obscured by the camera, say the cherry bella radish trial for Summer 2023, or the red romaine bok choy recipe for summer 2023. Additionally, some trials start with the plant already sprouting, like the dwarf tomato trial for summer 2023. It would take some time to select good candidate trials, and then parse the image data to select time-ordered images.
In terms of filtering out all of the data, the most basic thing I can think of is converting the images to grayscale, filtering the images, and detecting if there are any ‘white’ pixels from the filtered image to determine if the image has any plants in it. However, it probably wouldn’t fix some of the datasets having multiple plant species. I looked online to see if there was some sort of software that could automatically identify plant species, but I didn’t see any conclusive results.
Finally, is there a way I can download data off of the huroku app using some sort of api? Since there is a large number of photos, I’d like to see if there is a way to automatically download the files using some sort of python program to automate data processing.
I see that you posted this earlier on the marsfarm forums. I’m going to look at more in depth to see if it can answer my questions.
After doing some experimentation, I was unable to discover a way to login to the heroku web app using python to download the image data. Would there be some way to access the database directly so I could download the image data more efficiently?
We can set you up with access to S3 via Boto - but as you’ve already begun to learn through the UI there’s no easy way to automatically ‘clean’ the data.
Here is a link to a folder containing data from three trials. I asked @drew to extract the images from S3 and also include three Google Sheets - each of which has environmental sensor data for the corresponding device. The image name will contain the date/time - there should be one every hour. Similarly, in each of the Google Sheets you’ll see it also logs hourly - in this way you can match the environmental data to the corresponding image.
https://drive.google.com/drive/folders/1JwkBJBOaBa5CcJKo1W3PXdcKqrc4DrTt?usp=sharing
Don’t worry about this for now - the best model for recognizing a plant variety is ‘Planty’ by ChatGPT - I say that having tried 50+ Android apps. You’re on the right path to focus on being able to answer the question ‘is there a plant in this photo?’ The next question you can ask is what is the minimum number of plants (green blobs that aren’t touching other green blobs) in the photo - then try to separate those plants into different photos. Then from there - we can process the image assuming (for better or worse) that the measured outputs are attributes of one unique ‘plant’. We can count the number of green pixels as an estimation of the leaf area index (lots of papers on that) as a start. The interesting part of an algorithm like this is that it is agnostic to the type or age of the plant being measured. I believe it’s possible with the current data quality to recognize a plant that is declining in health - or stressed/in need of water.
We would use the leaf area index (total area of leaves) over 36 hours (plants ‘droop’ at night naturally) to calculate a ‘plant growth rate’ for the plant in that image. If at any time, the ‘plant growth rate’ goes negative - that is a predictor of a plant that needs attention. Make sense?
Alternatively, if a new plant is detected, it is likely a new seed germinating. Even though we can’t ID it, we can use the data from that image to calculate a germination rate - or even prompt the user to identify/label it for us.
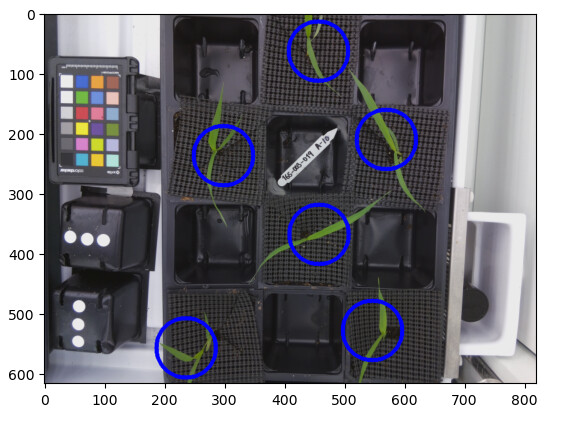
Using PlantCV’s dataset, we isolated singular plants from a picture and then used a rudimentary mean approximation to guess where the ROIs should be placed. We get this image.
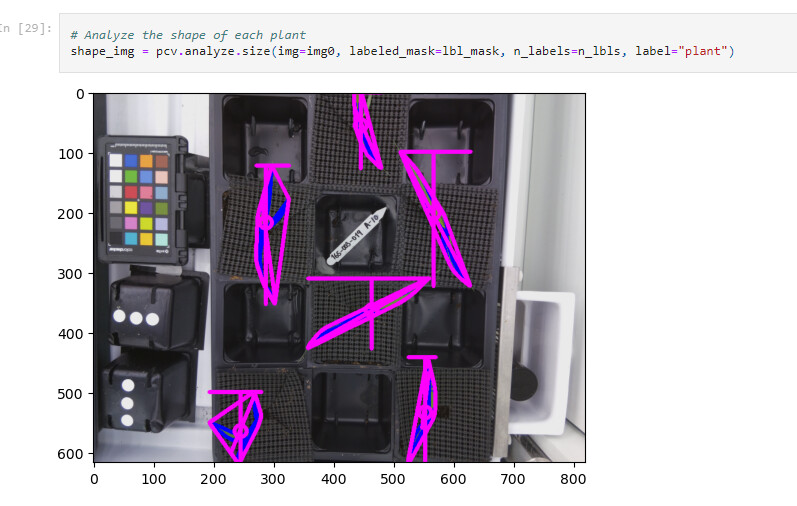
Utilizing another portion of PlantCV, we can analyze the shape of each plant to get a rough estimate of its shape and size based on the source data.
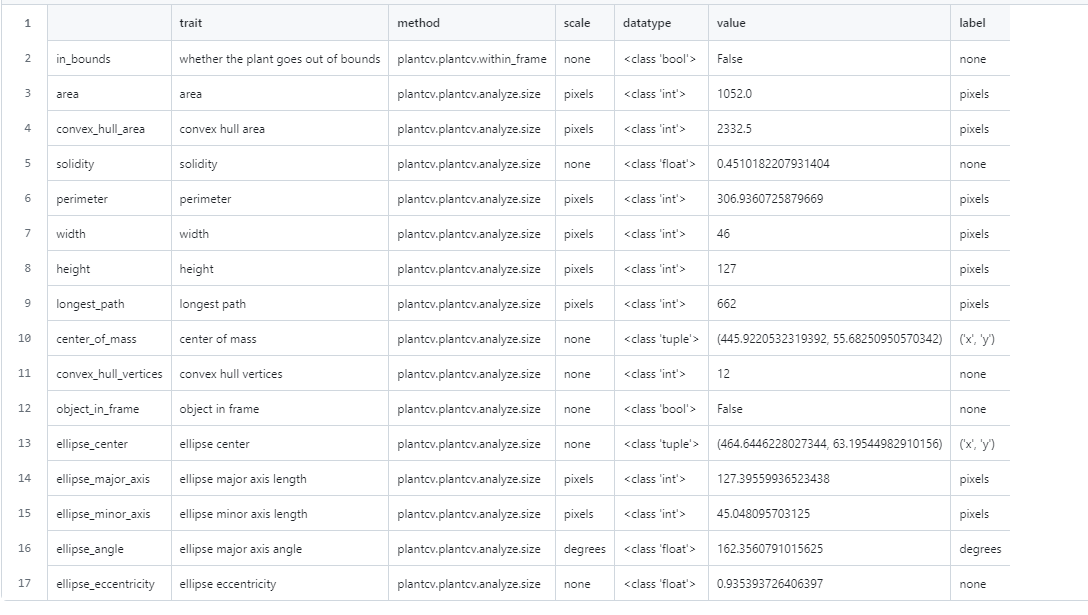
With PlantCV it can process the images of plants and return a dataset. Currently, this is what PlantCV is giving us for an output. The most important metric here is the “convex_hull_area”. This is the stepping stone to creating a Leaf size over time graph, a goal Peter has set for our team. These steps are the groundwork to eventually work with the MarsFarm dataset.
2 Likes
Also, just to clarify this was the ipynb that we were using for testing
The area and convex hull area are in pixels. Area literally just counts the number of pixels per image / plant, and convex_hull_area is the area of the convex hull around the plant.
Plantcv’s plantcv.plantcv.analyzse.size is using opencv as the backend, which is using this to calculate area and convex area:
https://docs.opencv.org/4.x/dd/d49/tutorial_py_contour_features.html
For now, we’ll use pixels as the default measurement. Since the plants are growing, they will have a smaller real area / pixel ratio as they grow upwards, which may make exact measurement of area difficult even if we did have a frame of reference to convert pixels to say squared centimeters or some measurement of that sort.
1 Like
I’m having some difficulty properly splitting up the leaf colors from the non leaf colors.
As an example, here is an attempt at converting an rgb image to lab and attempting to threshold using otsu’s method.
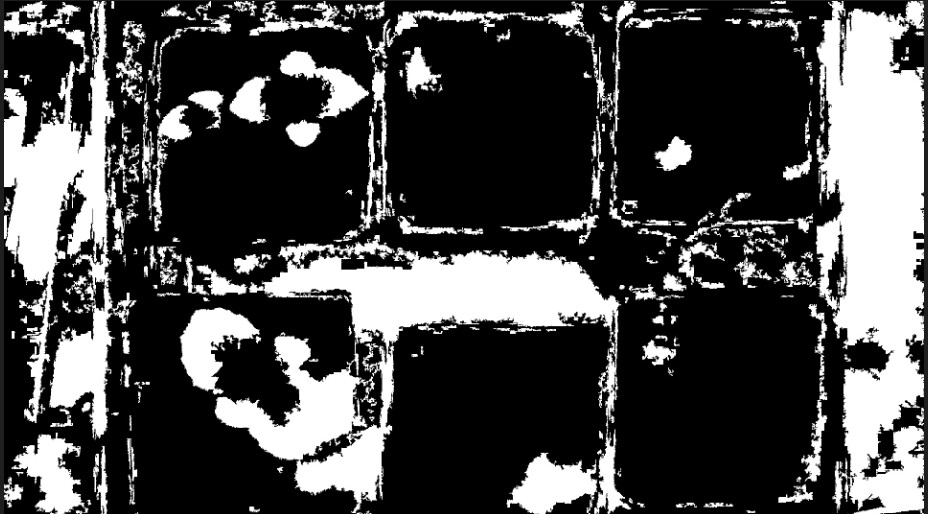
I’ll need to keep testing to see if there is a way to improve seperating plants from non-plants in an image.
Looking at the different types of plants being analyzed, it seems like different plants have different types of light that they reflect, resulting in different types of filtering being more effective than others. For now, what I can do is run a pipeline that does all of the options in parallel, since I don’t have a good method for determining whether or not an image is filtered to detect the plants. This would be a lot more manual than I’d like it to be ideally. So far, I’ve had the best luck with peas, which seems to work well with the workflow that I’ve already established.
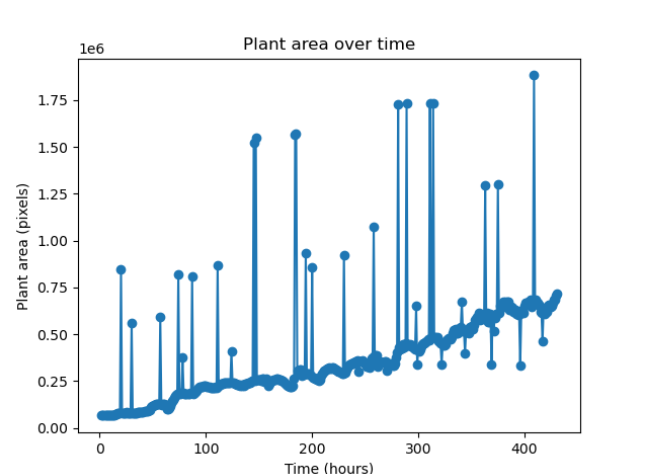
I made a graph of leaf area over time for the peas images. The graph seems to suffer considerably from noise, so I’m going to investigate ways to reduce the amount of noise in the image.
After working on some numerical methods to remove the noise, these are the graphs that I’ve generated
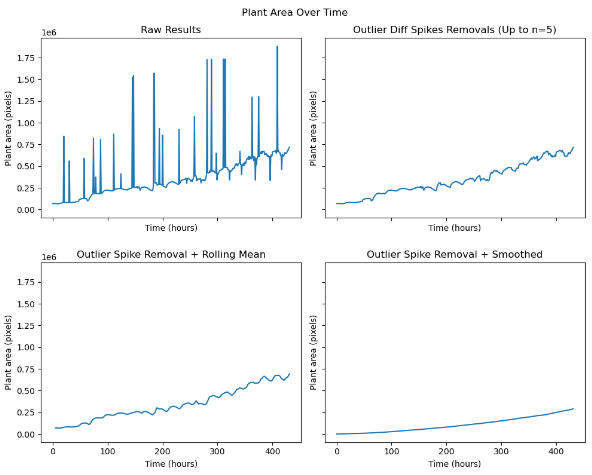
Here is the path to the script I used to run this
1 Like
Additionally, I finished development on a system to fully automate generating the ROIs from the labels. I still need to figure out how to accurately mask the peas and tomatoes, so hopefully that can get done by the end of the week.
1 Like
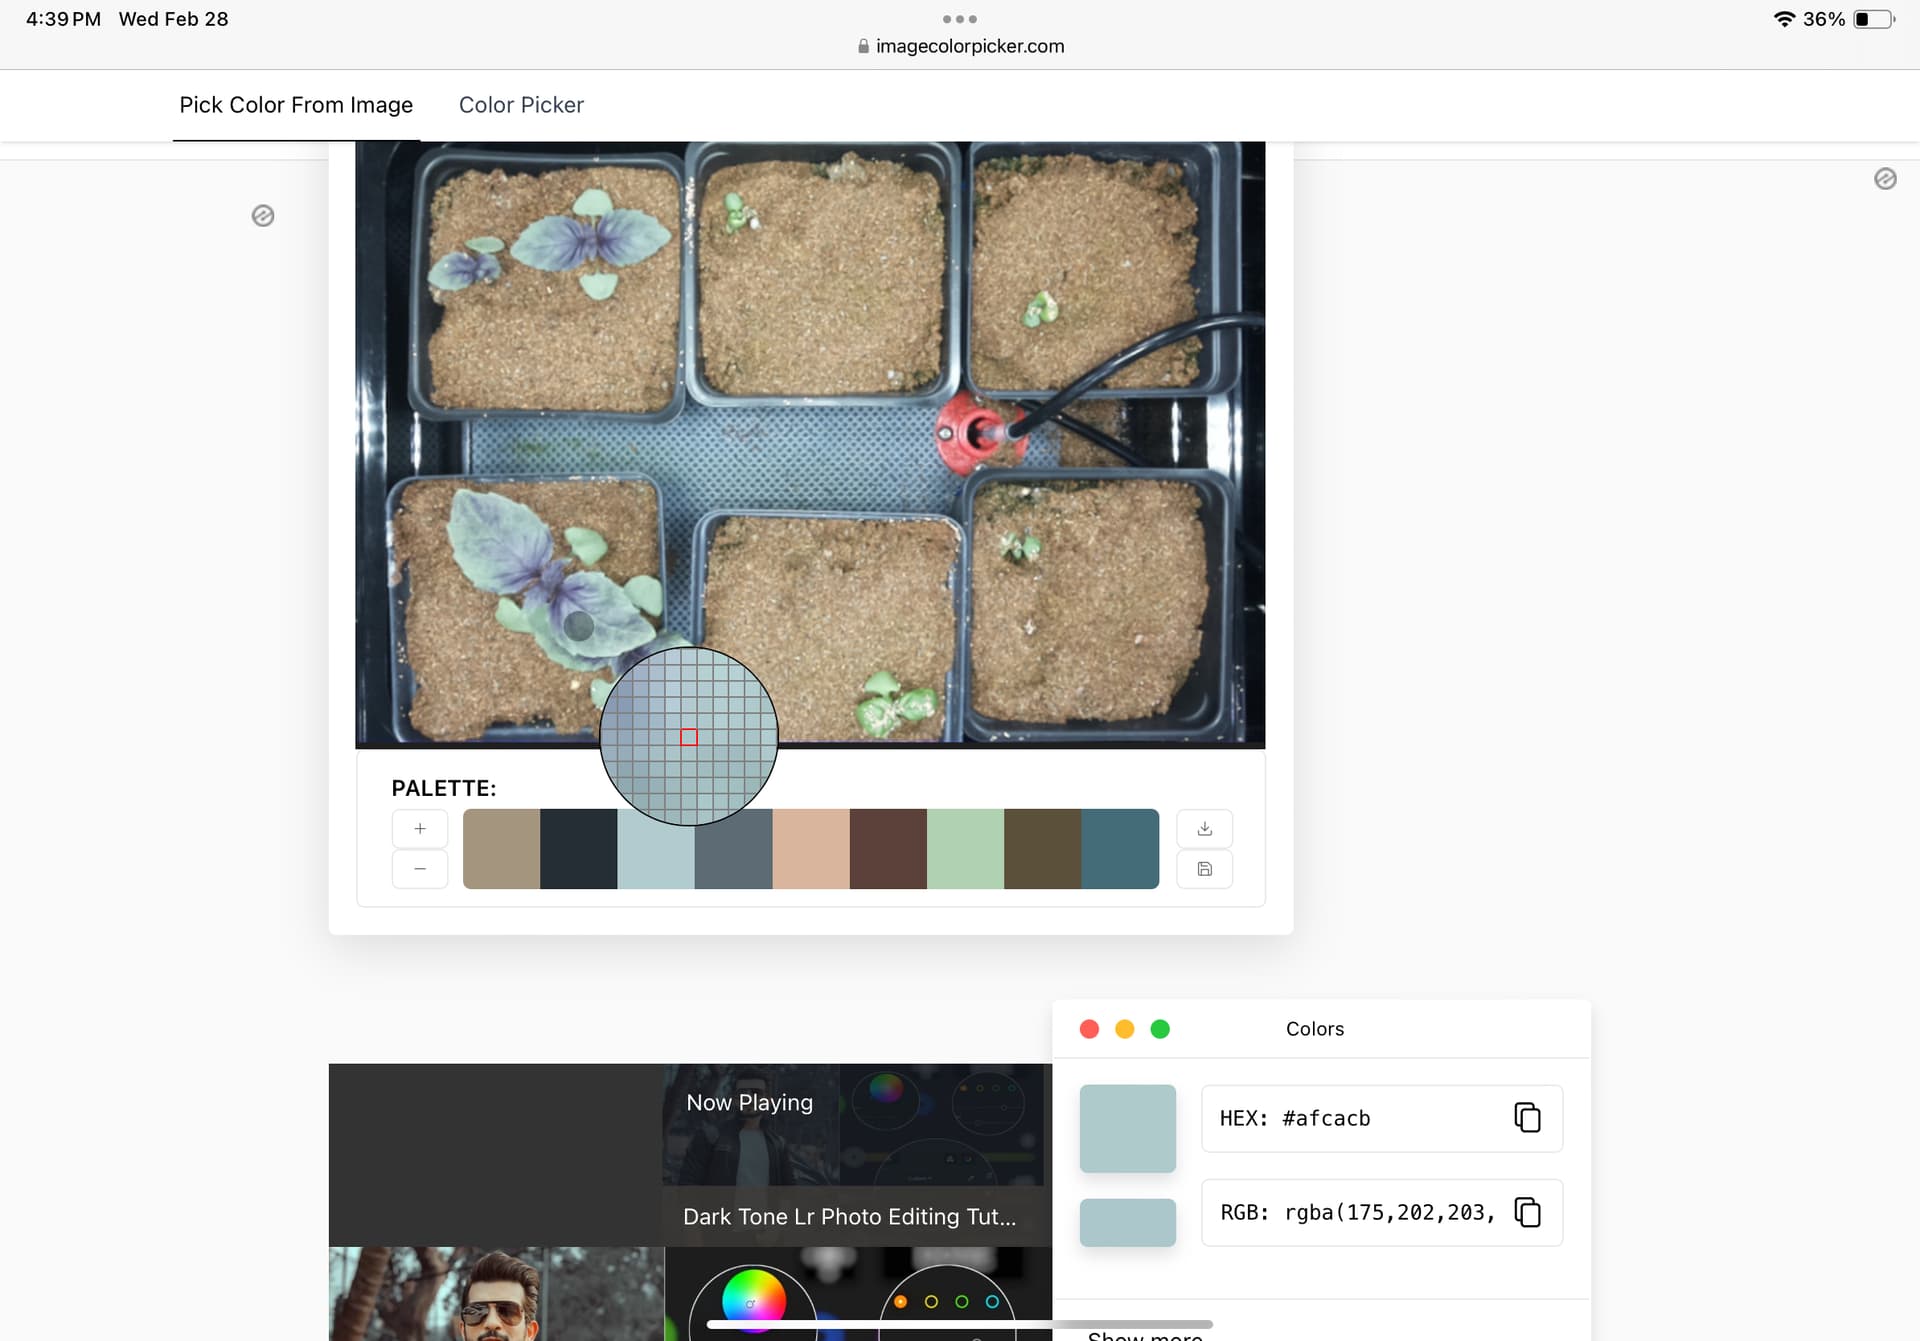
When trying to isolate the plants from the images using only plantCV was proving to be an issue. We found that the RGB value for the purple basil and the mat under the plants are very similar.
Here is the RGB value for the Plant
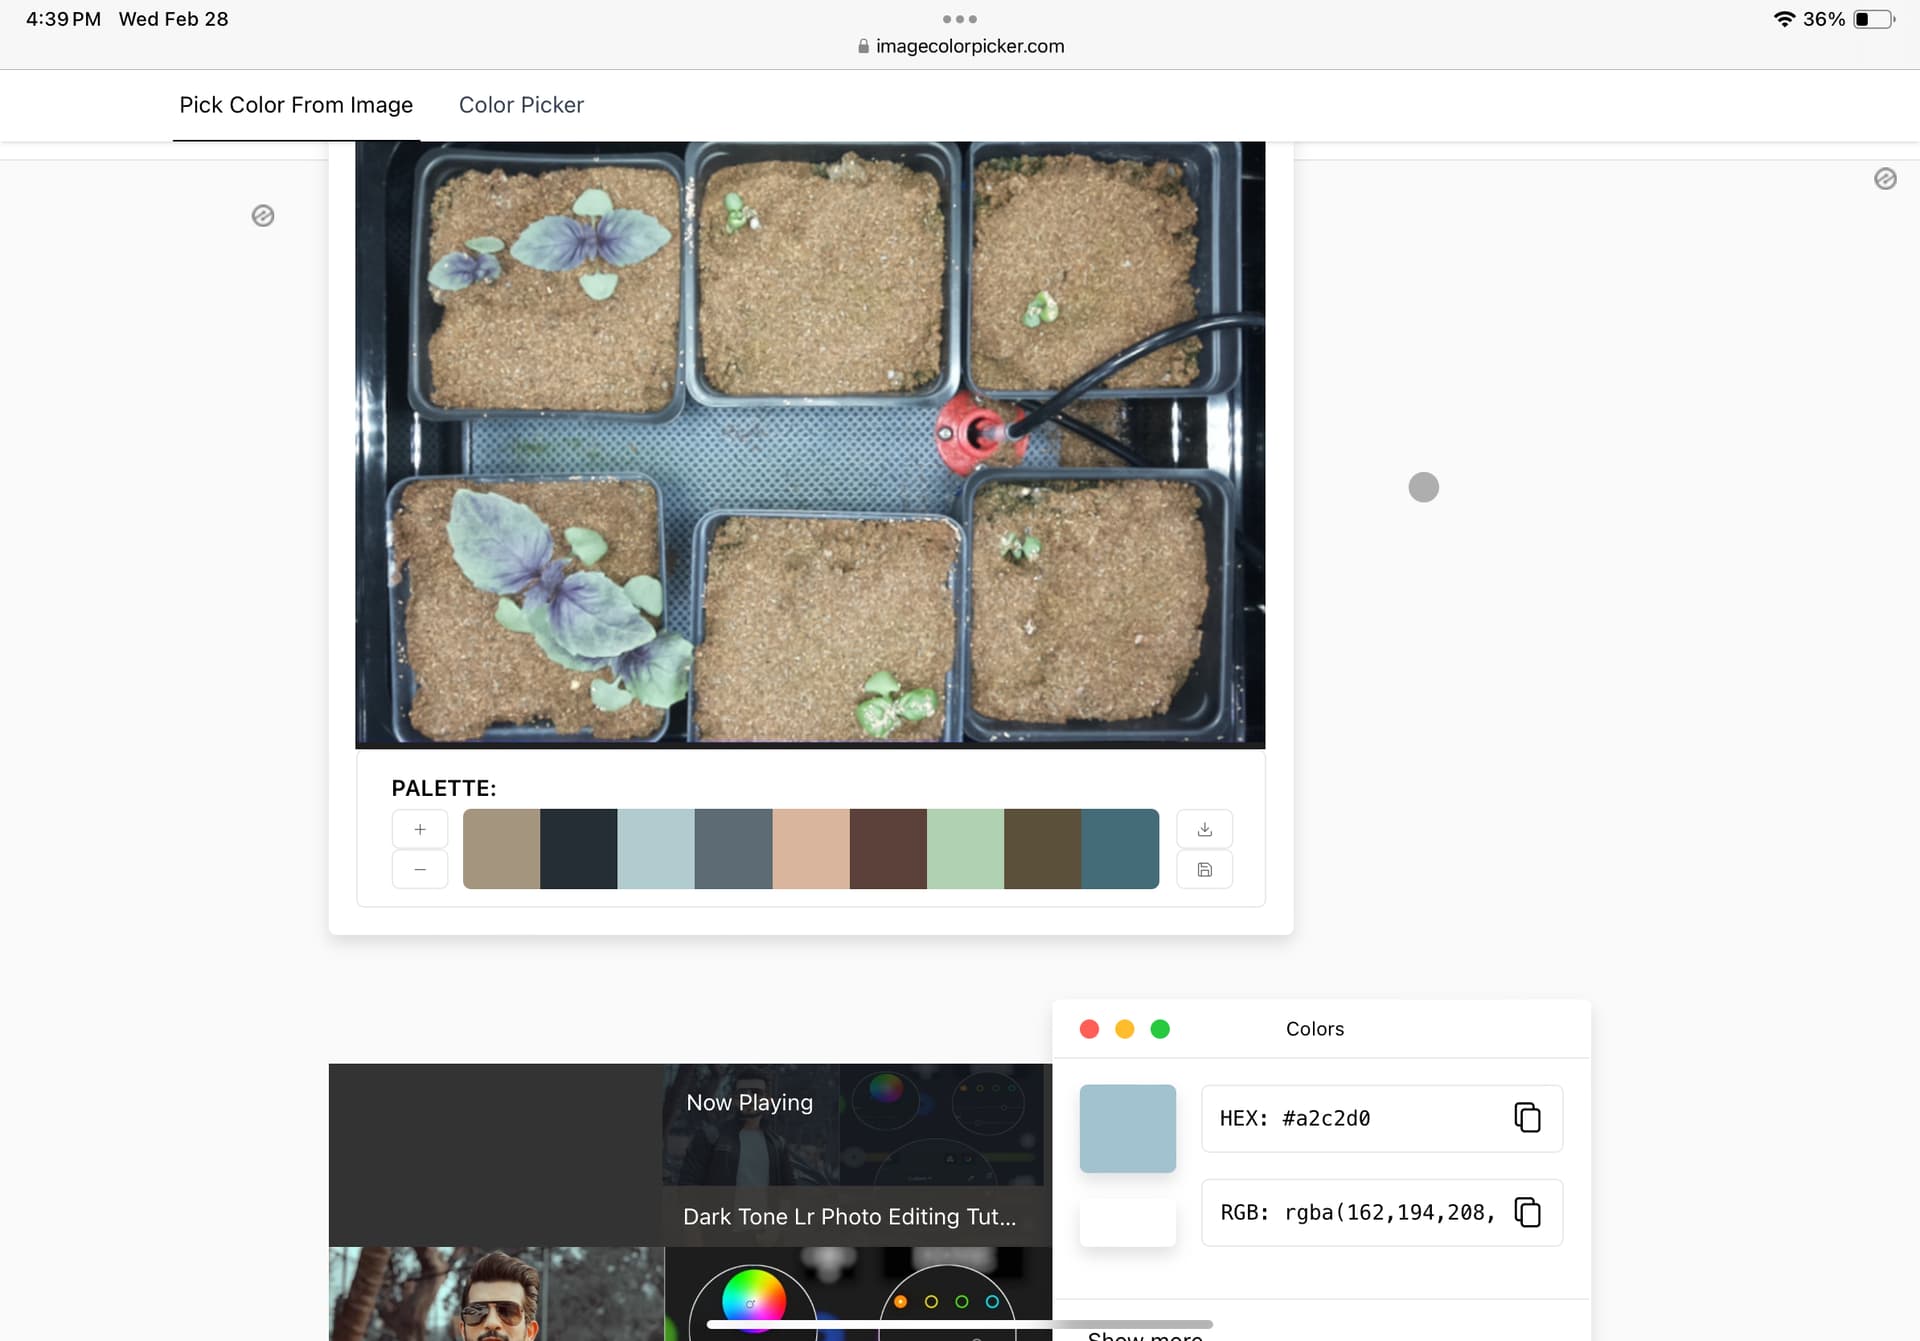
Here is the RGB value for the mat under the plants.
We wanted to ask the forum and see if anyone has an effective solution to this issue. We currently have one idea of how to fix this issue where we would recolor that portion of the image. Please reach out with any ideas to solve this issue.
Thanks for the great explanation of what your team has accomplished so far!
This is a great start - honestly. My goal had been to get to something quantitative and you accomplished that super quickly so great job.
Understood, keep note of these known limitations/assumptions we are making. If your goal is to help me as a business owner - then make note that these ‘warnings’ about what would cause it to fail are extremely valuable. This way, when a customer/partner responds to my pitch saying ‘Yeah but what about ___’ - I don’t look like an idiot. The only thing I only other thing I ask that you do for this (and other ‘warnings’) is to estimate the impact it will have if it does fail (plants will appear smaller than they really are) and under what conditions will it be most likely to occur (as the plants get larger, right before harvest). In this particular situation, my ‘answer’ is that this method will only provide quantitative phenotypic analysis for rosettes (because they stay relatively flat) - while I agree what you’re saying is a huge problem for Basil, for plants under 4’ tall - it’d be nice to estimate how big of a margin of error we have.
Great notes - could you share what that workflow is as of now?
Do you know anything about what caused the noise - from an image quality perspective? I know we have a bug that is causing the LED to not always ‘flash’ correctly (it should be white, not pink/purple) when taking the photo so I’m curious if that’s what is causing these or whether it’s more of a masking issue.
I thought you said your workflow was working well for peas, which is why you used them to prototype the charts.
Great initiative reaching out to the community - I think @Surendra is ahead of us though! I shared this thread of his current MV1 setup earlier in the thread:
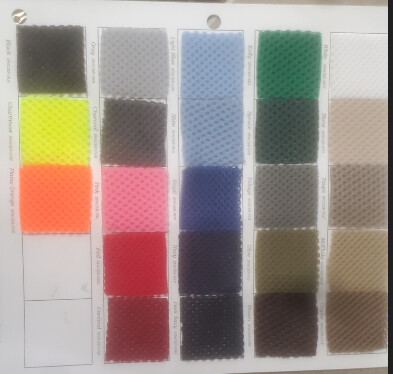
Here’s my idea: we switch the color of the wicking material and provide little covers (like shown above) for the tops of the pots - would that be a sufficient change @Holden? We have a variety of colors available for the wicking mat - what color would you recommend? I can throw this sample sheet in one of our MV1s too so it will upload some photos - I took this one in a hurry and it looks horrible in hindsight - ![]() .
.
FYI: @ajc3xc since you mentioned maybe hitting some limits with PlantCV, I would like to point you back towards the work that @hmw did, which I shared above. He used OpenCV to create a few workflows with similar goals using entirely OpenCV (no PlantCV) - maybe there’s something you can learn from his workflows/comments/OpenCV use cases. He was focused on some of the same problems we’re experiencing now - that the academic community (most of, if not all of the PlantCV contributors) doesn’t have because they move plants into an ‘ideal’ imaging chamber:
The biggest question to me is - when/what use cases will a more generalized CV model surpass PlantCV - specifically for processing top-down RGB images of multiple rosette plants to quantify a growth rate. I know that on our last call when I asked ‘So do you think PlantCV is worth it or should we just use OpenCV?’ @ajc3xc quickly answered ‘110% it’s worth it’ and went on to list several reasons. Unfortunately, I wasn’t taking notes and honestly can’t recall exactly what you said at this moment - so please share that so we have it on record - I’d appreciate that.
@ajc3xc @Peter
The operative word here should be “a while back”. Since that time a lot has changed. I have stayed away from PlantCV and OpenCV because all the library changes mean my code no longer works. I just picked up a Raspberry Pi 5, and plan to use it for some PlantCV experimenting. I am not too hot up on learning Jupyter Notebooks, but will see …
The issue seems to be how thin/thick the PlantCV layer is on top of OpenCV, and what value it adds.
This is not my top priority, but definitely something I will be looking into in the next month or two.
Sorry, I meant tomatoes and purple basil
The red mesh mat would be the starkest contrast for the plants.
From a CV perspective, the color of the cover is irrelevant; CV can distinguish any color range for filtering/masking. The tradition of ‘green screen’ for television is because there are no green tones in people’s flesh, and green is not a popular clothing color.
That is different with plants where green is the main color. Consider if there will be any flowers or fruit which may need to be factored into the decision (ie red strawberries).
I am not sure how the ‘nubby’ texture affects things, as it creates a blue/black pattern, rather than a flat, solid color. This may not be an issue, as it is likely you are doing the reverse of a ‘green screen’ process; you are selecting FOR a color (green), rather than trying to subtract out the background.
I assume that this is referencing which plants you are still unable to mask due to the matt.
Regarding mesh color selection:
Are we sure that ‘starkest contrast’ is the best rationale to use? This is completely speculation - but I have assumed that the reason PlantCV uses those blue little covers for the photos in their tutorials is because that’s the color they recommend. Maybe I’m giving them too much credit - but I assumed they picked blue due to some knowledge of botany and how that color is the most unlikely to occur in nature.
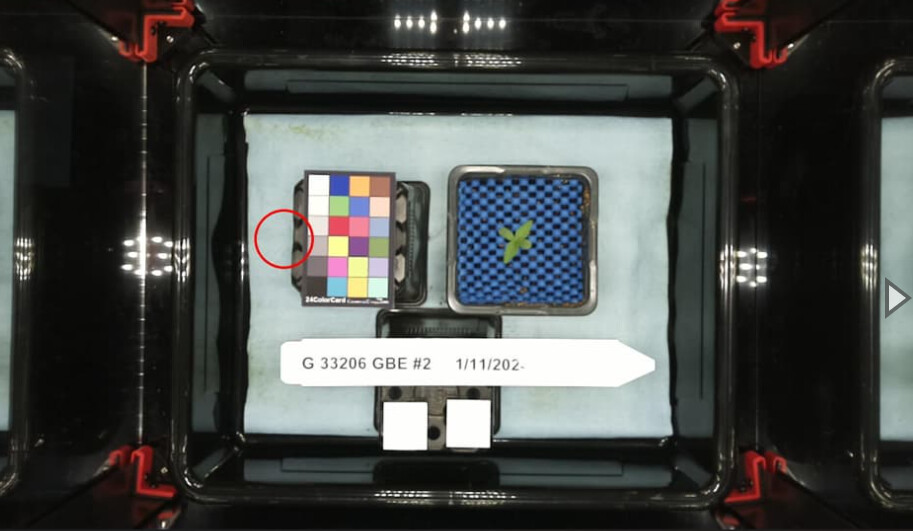
So I did a test yesterday by putting that sample card of mesh materials in an MV1 - here’s the photo:
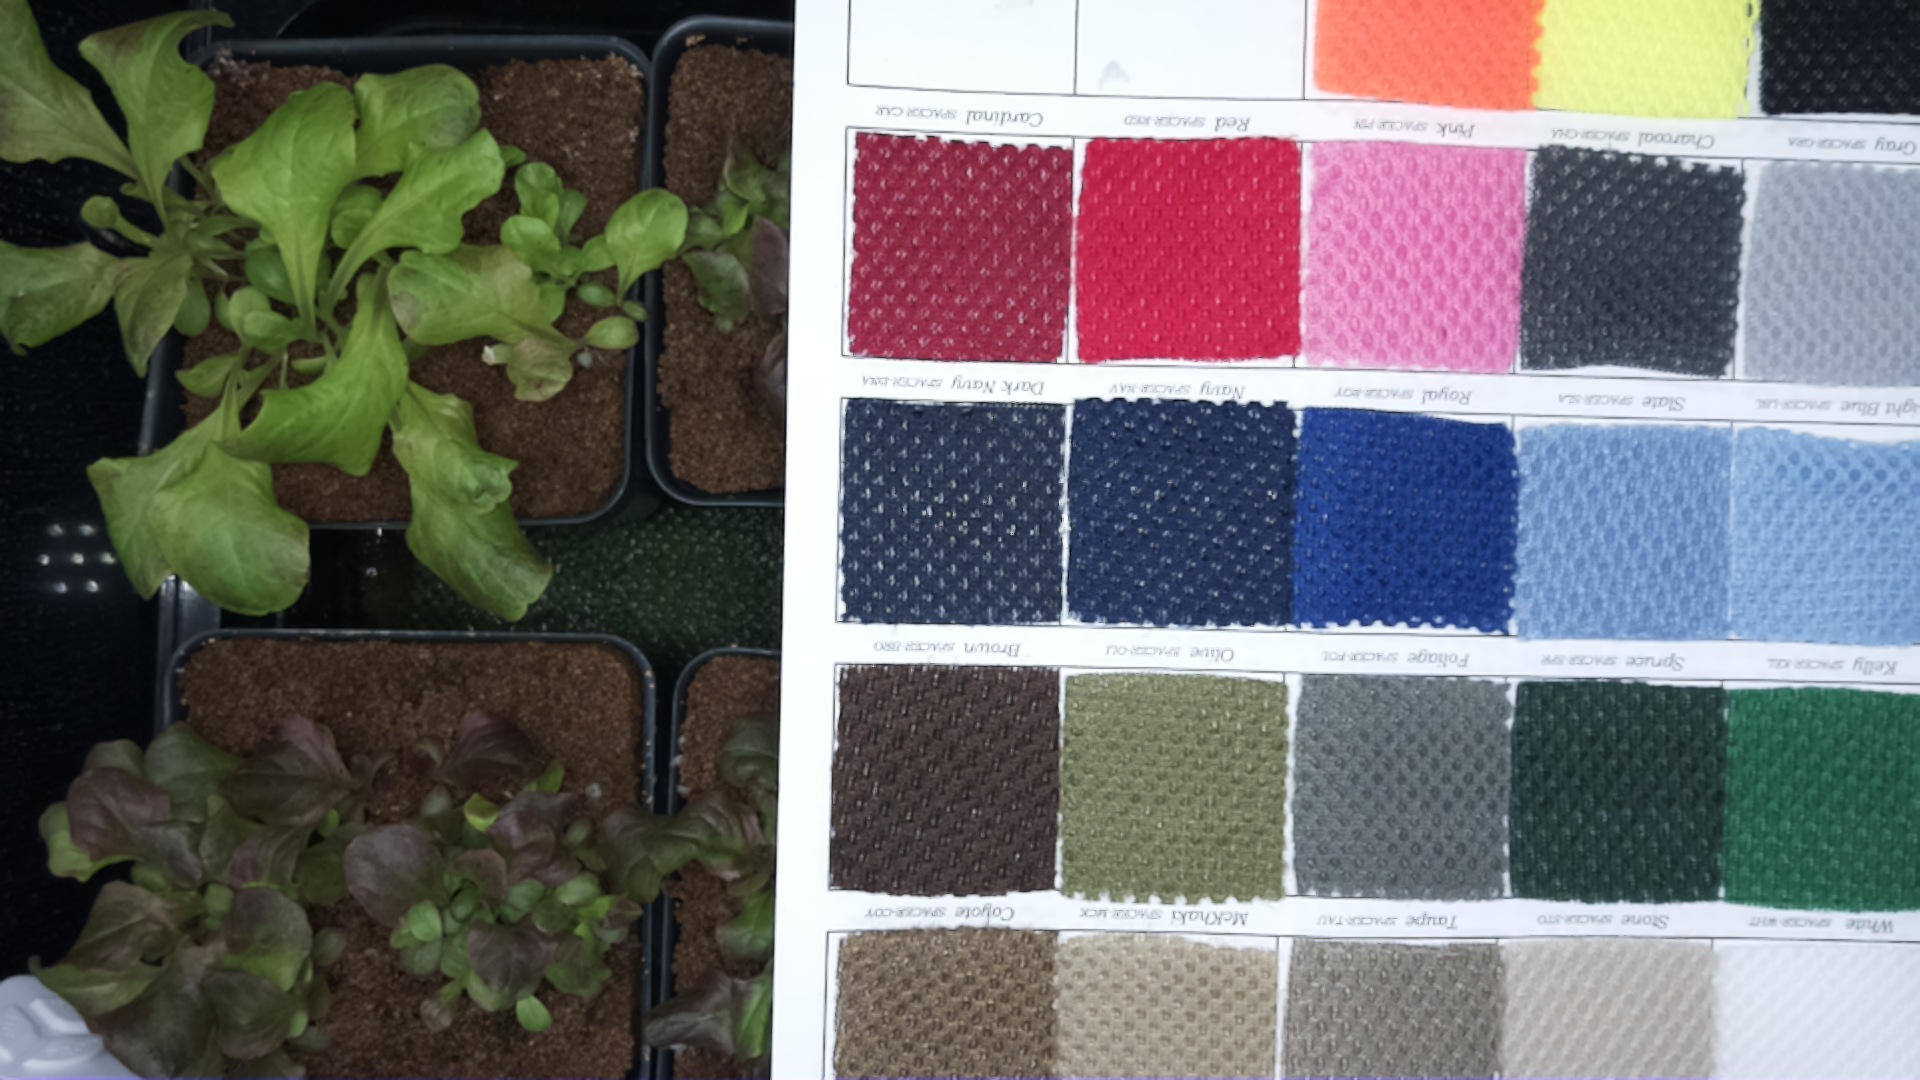
That’s one of NASA’s favorite plants underneath it, named ‘Outredgeous Red Lettuce’. I’d like to have @Holden do a quantitative analysis to compare the red, chartreuse (neon yellow), dark blue, medium, and light blue, and maybe even pink. I’d just like to make sure that we’re doing our diligence here before I go ahead and order our top 3 to try out.
@ajc3xc @Holden I would like to be able to go through the <1,000,000 images collected from MV1s and be able to answer some basic questions about them. I think we’ve been focused on the last part of a process that would result in a school having a quantifiable phenotypic metric associated with the dataset they create in an MV1. I honestly am super impressed already with how far we’ve gotten extracting leaf area (as a measurement of pixel color) and think that even if the algorithm is somewhat ‘dumb’ - as long as we show our work (showing a masked image to a user, for example) a ‘clean’ set of images into quantifiable phenotypic traits. I estimate though that in reality, a good 500,000 of those images don’t even have a reservoir/pots in them because they were taken during testing or before anything was planted. Then another 250,000 probably have empty pots or dead plants - so for step #1 what we want to do is create a process to label the useful images that contain live plants so they can be filtered.
In the long term, rather than manually cleaning up those images, I think we really want to be able to build a layer of ‘image analysis infrastructure’ to be able to extract 'clean datasets continuously from those raw buckets of images. This doesn’t have to be perfect - right now we have nothing though. Here’s how we could structure a procedure that would cycle through all of the photos collected from the ~100 MV1s over the last year:
-
Check if there are seedlings/plants in a trial Each MV1 has a directory within an S3 bucket containing all of its images. We can use the metadata field of ‘trial’ to strategically sample images from those directories (check image 40 of a user-created trial, if nothing, then image 100, 300, 700, etc.) to find where plants first appear. You would want this to be a pretty simple script so we can easily run it on ~1,000 images numerous times so we can iteratively improve upon it and it routinely on all of the device directories. My goal is to achieve a 98% accuracy rate in detecting if a plant is in that trial, with a preference for erring on the side of false positives. Essentially, I’d rather have the system incorrectly flag an empty MV1 as containing a plant than miss an actual plant. This approach prioritizes reducing false negatives at the expense of increasing false positives. With this high level of confidence, we can then update a binary metadata field on the S3 object named ‘hasplants’ - for every image in that entire device directory.
-
Identify what is being grown in the trial - We can select a photo containing a plant that is ~14 days old (based on when it first appeared in the trial), which is when I estimate we’ll best be able to identify it. I want to try to use the OpenAI vision model (others may be close or even better - but I haven’t seen it) to identify the plant(s) in the trial. If we can validate that it works as well as the ChatGPT Plus interface (see above examples earlier in this thread) for IDing the plants on a handful of images, then I can begin to also test it for other things that I’ve gotten Plus to do and that an LLM is good. Another example would be to determine whether they’re using pots/hydro setup for that trial, really it’s any kind of non-quantitative analysis that doesn’t rely on counting of pixels.
-
Extract phenotypic measurements Our real goal here is to be able to answer the question of ‘how much food is this?’ - which means we have to take it a step past just measuring how big the plant is. I shared some papers earlier about methods of correlating leaf area to edible biomass for plants where most of what you eat is their ‘rosette’ leaf structure - meaning if it doesn’t work for Basil and tomatoes - I understand. The ability to use leaf area to calculate a harvest metric like that only really applies to our datasets that contain Bok Choy and Lettuce now though - given what has been grown in MV1s (that I know of) currently.
I am getting back into working with PlantCV/OpenCV. At the moment I find OpenCV does enough that I am not getting into PlantCV (yet).
Hardware/Software Issues: I picked up a Raspberry Pi 5 to dedicate to CV, and found a few issues that are different from my well loved 3B+.
- It needs a better power supply. A wall wart and cable don’t cut it (even though it uses a USB C for power). Since th 5 can have hard disks attached, you need a 5V 5A. I was crashing till I upgraded.
- Virtual Environments - I was use to treating each Raspberry Pi as its own virtual environment, but 5 requires you actually build a virtual environment before it will let you install libraries (PlantCV). I am using Thony, and once I built an environment (using Thony), I was easily able to use its package manager to install PlantCV. Part of the PlantCV install includes OpenCV.
Image Evaluation : To be blunt, most of the images in the repository are of little value for complex evaluation.
- There are multiple seeds per pot, rather than being thinned to a single plant. They quickly overlap. You can do mass evaluations of all plants in the box, but not isolation of individual plants (or seedlings). This might be good for studying best plant density, but phenotype work is better done on individual plants.
- Pots not straight - This is not an issue for growing, but it makes it more difficult to isolate individual pots (see my section below on ‘cheating’)
Cheating : I strongly believe that never use software to do something that can be better done by cheating. The camera if fixed in the MV1, so take advantage of that to calculate a few things
- Pixels per cm. Use the width of a pot (or a ruler) and determine how many pixels it covers in a standard image. Now you can count the number of (green) pixels in an image and can know the size of the plant. If you want to get fancy, cut out a 1 sq/cm green square, take a picture of it, and count the pixels (using the plant counting software).
- If your pots are nicely arranged, you can pre-define a grid to clip each pot into a separate image, and work with one plant at a time.
- You can also define a mask to clip out the walls and irrigation to ‘declutter’ the image.
Results
This random image shows some of the problems; but also shows what can be done to find “plants”. The process was: - Create a mask using a color range (green)
- Erode and dialate the image to remove small stray islands.
- Find the edges (Canny edge detection)
- For each contours (islands), fit an elipse to it
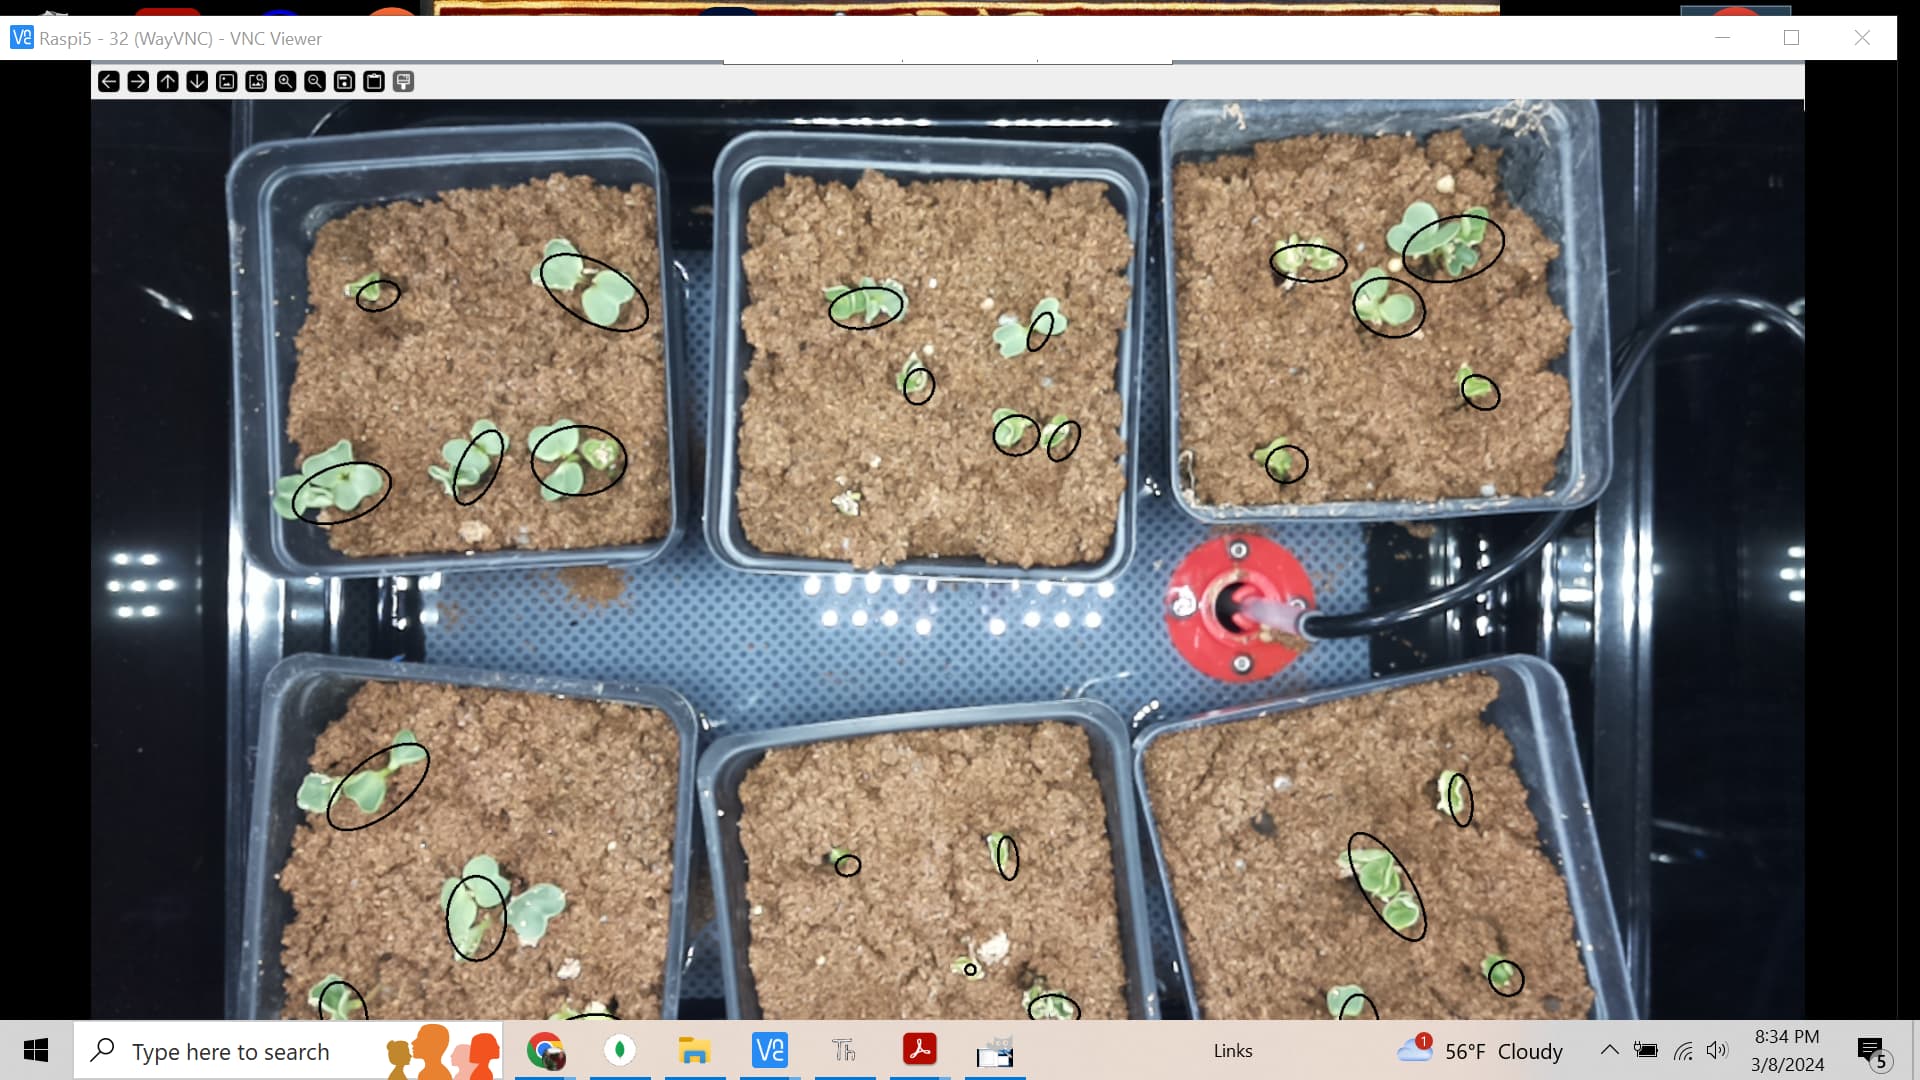
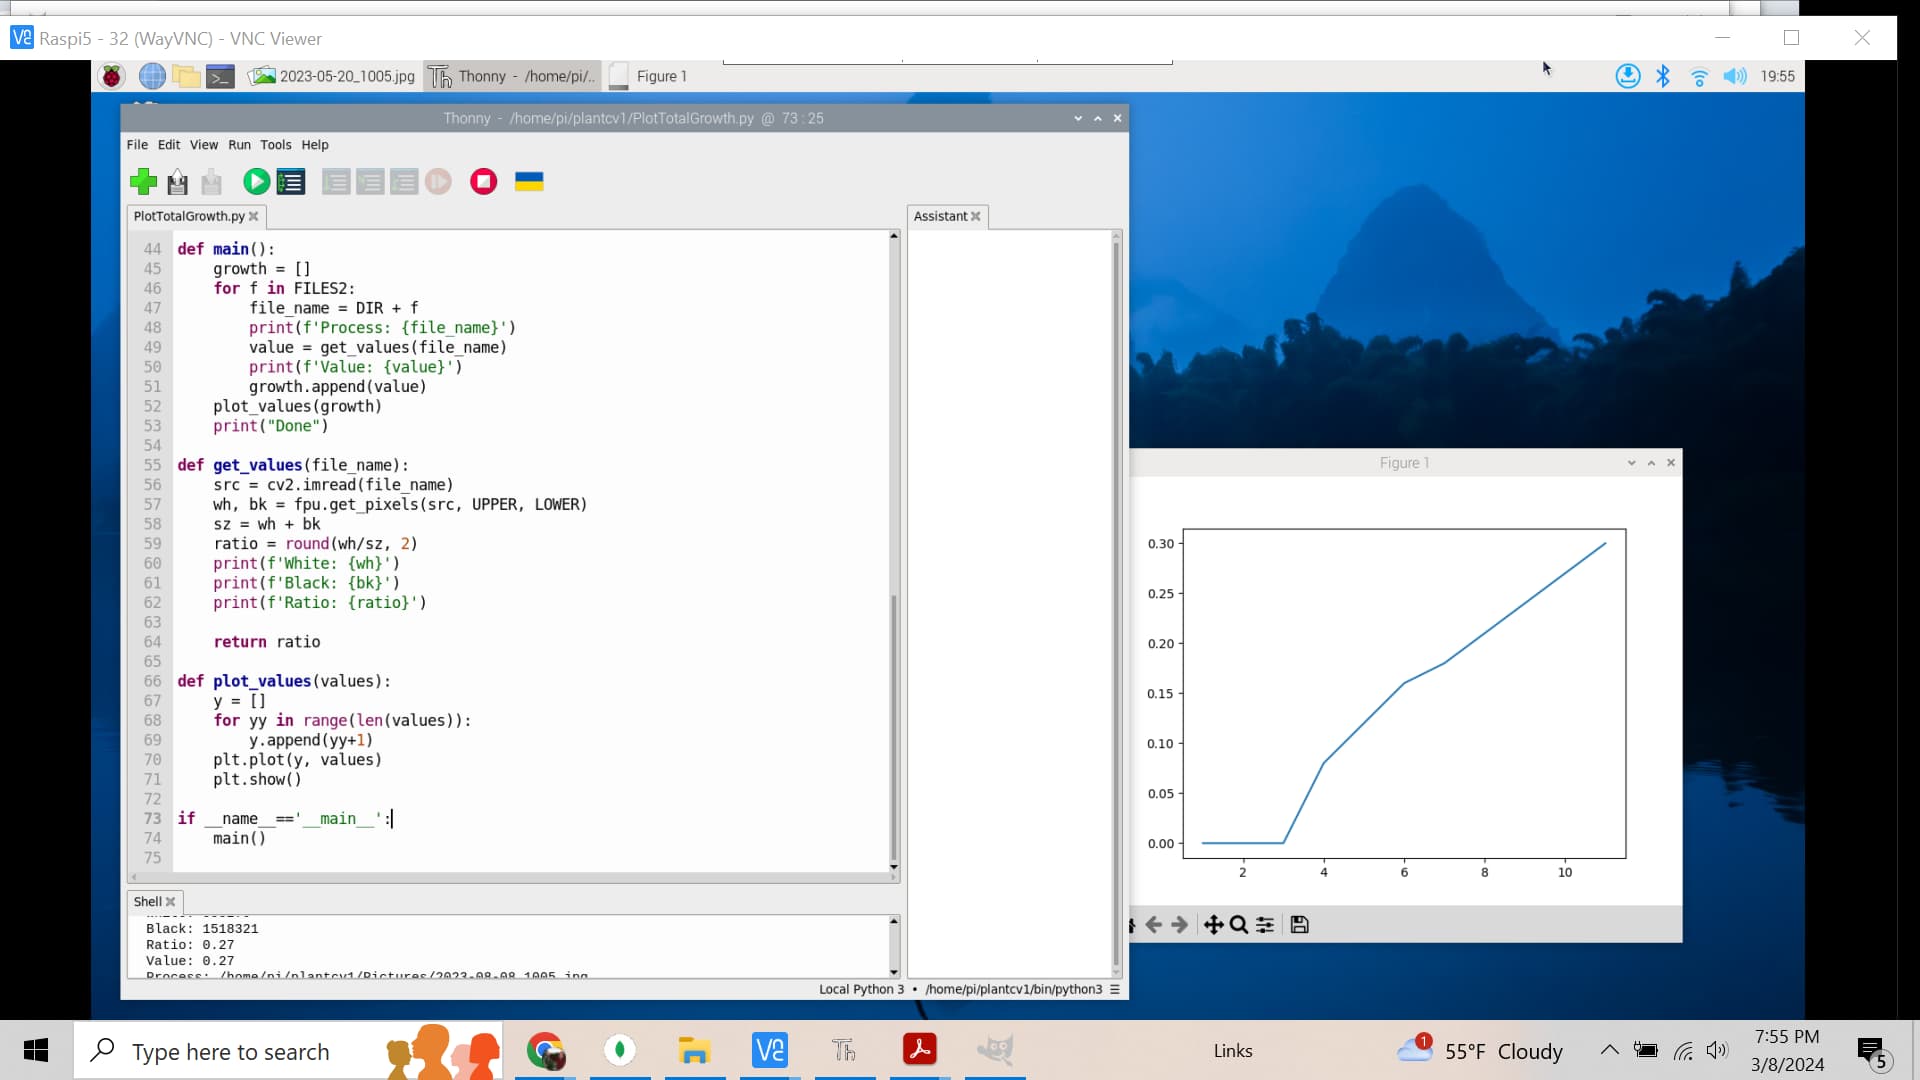
The following counts the green pixels in a series of images and plots the count. This could be converted to total canopy size (using pixels per cm). This would also handle the problem of finding trials with/without plants.
1 Like
That seems pretty impressive. Do you have a github / code link to the file that you used to generate the ellipse images?
I’ve got started working on a similar process tonight. This is how far I’ve gotten.