MARSfarm High School Intern - Jamira Guillory

Hi, my name is Jamira Guillory and I am 16 years old and a junior in high school. I’m from a city called Westlake in southwest Louisiana. One of my favorite hobbies is to binge watch Netflix while crocheting. My agricultural background began my freshman year when I was thrown into Agriscience 1.

Another classmate and I conducted an experiment on how light duration effects the amount of edible mass in Bok Choi using the MARSfarm Minis. With this experiment we entered into the FFA Agriscience Fair where we got first at state convention, and seventh at Nationals. The experience of using the hydroponic units for an experiment has shaped my career goals, I now want to become a research scientist in controlled environment agriculture.

In this thread I will share all of my findings/knowledge gained throughout my projects. Beginning with research on finding the ideal conditions of growing strawberries in the MARSfarm units. I hope you will find the journey of this project as interesting as I already do.

6 Likes

So excited to have you Jamira!

1 Like

This is going to be so much fun!

Its been a while since I’ve updated, so I’m going to talk about the progress of the strawberry experimental project. Two weeks ago the strawberry plants that Peter had mailed arrived. They weren’t in the best condition, so we gave them a week before making the transition into the MARSfarm Mini units.


^The 3 strawberry plants came in one pot and looked like this.

To begin the process of recovery I trimmed all dead parts of the plant. If the leaf was crunchy and black it was trimmed. If the stem was black and brown and looked beyond recovery it was trimmed.

After trimming off the unhealthy parts of the plant, I prepared the growing medium (the materials plants are grown in). I mixed 1500mL of vermiculite with 2.5 gallons of coco coir. After mixing the materials I added 1750mL of water and mixed it in as well.

Now that the medium was prepared, it was time to transfer the plants. When taking the plant out of the soil it was important to get as much of the old soil off of the roots as much as possible. It’s ok to be a little rough when trying to get the soil off. Break off big pieces, shake it around, and even hit the sides with you hand. If there’s still some left, it’s not the end of the world.

After getting a lot of the old soil off of the roots of the plants I transferred them to a new pot. I made sure the plant was in the center, and then filled it with the vermiculite and coco coir mixture. I then put the pots into a tray with a wicking mat.

Now that all of the plants were prepared, they were put into their own MARSfarm mini unit. The photoperiod was set to 7 hours for each of the units.

The goal of this was to get the plants back healthy again. After being without any water or sunlight while being mailed they aren’t in good condition and aren’t ready to begin an experiment. Despite the setback I will continue to look forward!!!

5 Likes

@Jamira this is great! Sorry that the strawberries got so beat up - I did my best to pack them up snugly but clearly, they still took a beating.


Brocolli

I’m glad to hear that you’ll be trying some other crops too (spoiler: broccoli) in your other three MARSfarm’s. I tagged you in another post last night - where I shared some USDA data about what cultivars are grown in the two states where most of the Brocolli is grown. It looks like AZ grows several varieties - though I’m not sure if these overlap with any of the ones you’ve planted.

Here’s a table that shows how much land (measured in acres) is used in AZ and CA to produce brocolli. It also shows the average price (measured in dollars, see how AZ gets $41.20 and CA gets $33.20 - that’s probably because people pay more in the winter when its too cold to grow any in CA.


Strawberries


Broccoli for Fresh Market and Processing Area Planted and Harvested, Yield, Production, and Value
by Utilization – States and United States: 2008-2012

Also, while there may not be much variation in the cultivars of Broccoli grown, there definitely is in the varieties of strawberries. Check out the table on page 78 of the Vegetables Usual Planting and Harvesting Dates Report which lists the primary strawberry cultivars grown in each state.


Strawberries for Fresh Market and Processing

It’s also interesting to note that the strawberry market is worth $2.2 BILLION - nearly four times the size of the Broccoli market - which according to the table above is worth $678 million. More demand + shorter shelf-life = more funding for research, more agricultural research = more cultivars specialized for growth in a specific region.


Strawberries for Fresh Market and Processing Area Planted and Harvested, Yield, Production, and
Value by Utilization – States and United States: 2012

1 Like

Also, for anyone who wants more context about Jamira’s school - check out this forum post as well: Westlake FFA - Regina Smart's Ag Program

1 Like

I checked on the plants this week and they aren’t doing all that well. I gave each of them 500mL of water. Watering them directly with 150mL and the other 350 just going into the tray.


I’m not very confident in them making a full recovery, but even so we have another plan in place.

Like Peter mentioned, for right now I will be growing broccoli! The condition of the strawberries aren’t well enough for me to perform an experiment, so I will wait until strawberries are back in season in Louisiana.

For right now I will be doing a variety experiment with broccoli. The varieties are melody, sweet bunch, and BC1611. These dwarf broccolis are said to only take 30 days or less to reach maturity. I am excited to see how each broccoli will perform in the MARSfarm mini units, and if the information provided by Johnny’s Selected Seeds will hold true.

2 Likes

While on zoom with Peter he brought up the MARSfarm units interface. This where you can view the data collected by your unit. Things like, humidity, temperature, carbon dioxide levels, and pictures can be viewed.

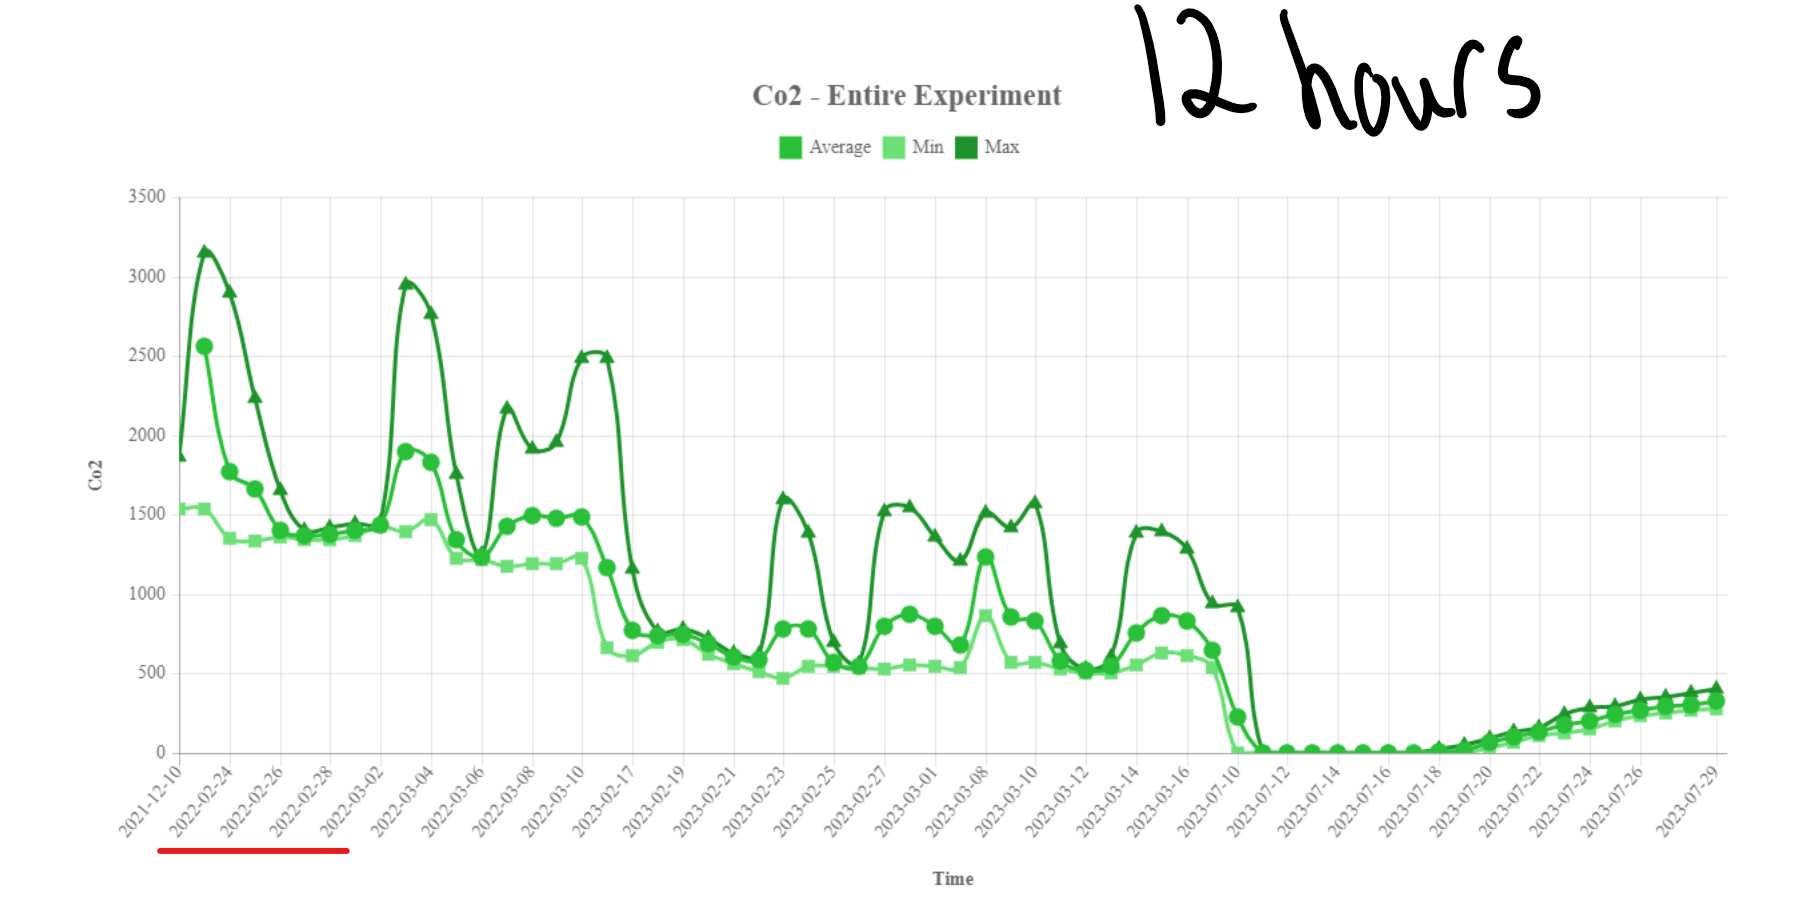
I want to talk specifically about carbon dioxide levels. Peter explained how it was possible to make assumptions just based on the CO2 levels. How you can tell whether there is or isn’t a plant present, or if a student was near your unit, and even if your plant is performing well. So, I decided to look at the carbon dioxide levels in the units.


When looking at the graphs you can tell which part was during the school year and when summer break started, even without looking at the dates. When the CO2 levels are high that means there are students present and plants taking in the carbon dioxide. The levels decreased in the summer because there are no longer students coming in and out of the classroom taking in oxygen and turning it into carbon dioxide. Since I go to the school every now and again to check on the units and do some work, the carbon dioxide levels go up, so the small spikes at the end of the graph let me know when I was at school.

The underlined portion of the graphs was when a light duration experiment was conducted in the units. 2 units were set the 6 hours, 12 hours, and 18 hours of light duration. The units with 6 hours and 18 hours had a similar pattern in their CO2 levels. Averaging at a approximately 1200 and gradually decreasing to about 400. This comes as a shock to me because the results of these 2 light durations were the complete opposite. When it came to edible mass, 6 hours produced a significant amount, while 18 hours of light duration produced 0 grams of edible mass in Bok Choi.

12 hours of light duration only had a little more than half the amount of edible mass 6 hours produced, but the CO2 levels were much higher, averaging at approximately 2500 in the beginning and decreasing to 1500.

This poses the question, was it the duration of light that caused the Bok Choi to become non-edible, or was it something else?

While doing research for the strawberry experiment I learned about DLI. DLI, or Daily Light Integral is basically the amount of light a plant receives in a day. There are multiple factors of DLI but 2 main ones that effect the amount of light received is the duration and the intensity. Plants can reach the same DLI with different light durations. One having a shorter photoperiod but a more intense light, while the other has a longer photoperiod but the light is less intense. Despite having the same DLI the delivery does matter.

What I’m getting at is, if the light was less intense, could the Bok Choi at 18 hours of light perform just as well, or even better than, the Bok Choi with 6 hours?

Looking at the CO2 levels only, can help answer, or create a lot of interesting questions. If anyone has any thoughts or has experienced similar situations feel free to share. I am still learning a lot and I’m sure there is a lot of valuable information I am unaware of.

4 Likes

I am excited to say that this Tuesday I planted the seeds to begin my broccoli variety study. I am comparing 3 different broccoli varieties to see which does the best in the MARSfarm Minis.


It was recommended that I completely randomize where each plant will be in the units. Since this is a variety study it is important to see which plant does well no matter what unit it’s in, or where in the unit it is. Normally I would’ve put the same variety all in one unit, so 2 units for each variety. Instead, each unit will have 2 plants per variety, and where they were placed was completely randomized.

Using a random generator, I generated a sequence using numbers 1-6. 1 and 2 represented the Sweet Bunch variety, 3 and 4 was the Melody variety, and 5 and 6 represented the BC1611 variety.

It has only been 1 full day and the broccoli are already starting to germinate. In every unit the BC1611 variety has shown the start of growth. The other two varieties aren’t as consistent. While this doesn’t necessarily mean the BC1611 variety will perform the best, it does play in their favor.


I will continue to update this thread on which variety is winning the race to harvest.

3 Likes

Earlier this week, the plants were ready to be thinned out. I originally planted 3 seeds in each cube of rockwool. This ensures you will have at least one plant germinated in each cube of rockwool. Below is a picture of how the broccoli plants looked before being thinned out.

I thinned them out to only 1 plant per rockwool cube. Using a set of tweezers I plucked off the other 2 seeds if they germinated. I chose the the plant that looked the best. There’s not much to go on since there’s only a small, skinny stem and a few leaves, so how you determine which is best is up to you. I look at which has the most leaves with a stem that looks the most stable. Below is a picture of what it looked like after I thinned them out, only one plant in each cube. At that point they weren’t ready to be put into the net pots, so they will just sit under the light for now.

3 Likes

Great explanation of thinning! Keep up the great documentation @Jamira!

P.S. Here’s how you could describe the ways in which you can talk about how the projects you’re documenting are demonstrating the real-world STEAM skills you’re learning in school (I’ll use the A for Agriculture - ha!) - I encourage you to think of your high-school agriculture education experience as a portfolio of projects that you can use to communicate how you work to create things - regardless of what skills are needed. Letting “projects” get you interested in subjects that you otherwise may not have identified as interesting is perhaps the greatest benefit of project-based-learning and the freedom to pursue those projects for months at a time is something a lot of agriculture students may take for granted. What I’m saying is that you’re getting an experience that most students in urban areas don’t get to have - so think about how you can use that for the rest of your life to communicate how you’re better suited to do _____ than the majority of other high-schoolers who didn’t have that experience.

I was using ChatGPT to help me summarize the ways the MV1 could be applied to STEAM (ag again) and had created a table format I liked. Then I gave it a link to your forum topic and asked it to explain which of those skills you had already demonstrated in this topic. The full conversation also has several tables related to integrations in CDE/SAE/Agriscience Fair/etc. which others may be interested so I will also share a link to that below.

Response from ChatGPT-4:

Link to entire conversation with ChatGPT-4 (with web plugins to access forums)

Based on the thread about Jamira Guillory’s experience with the MARSfarm Minis, create a table showing how he has demonstrated various skills related to STEAM education:

Name Description of Task for Students Science Technology Engineering Arts (Agriculture) Mathematics
Light Duration Experiment Conduct an experiment to understand how light duration affects plant growth. Jamira conducted an experiment on how light duration affects the amount of edible mass in Bok Choi. Utilized the MARSfarm Minis’ interface to set photoperiods. Participated in the FFA Agriscience Fair, winning first at the state convention and seventh at Nationals.
Strawberry Recovery Learn how to recover plants that are in poor condition. Jamira received strawberry plants in poor condition and took steps to recover them using the MARSfarm Minis.
Broccoli Variety Study Conduct a study to compare the growth of different broccoli varieties. Jamira is conducting a variety experiment with three types of dwarf broccolis to see how they perform in the MARSfarm Minis.
CO2 Level Analysis Analyze the carbon dioxide levels in the growth chamber and make assumptions. Jamira looked at the CO2 levels to understand various factors like presence of students, plant performance, etc. Used the MARSfarm units interface to view data collected by the unit. Data analysis of CO2 levels to understand plant growth conditions.
DLI Research Research and understand the concept of Daily Light Integral (DLI) and its impact on plant growth. Jamira learned about DLI and questioned if light intensity could affect plant growth differently than light duration.

Note: Cells are left empty where specific examples from Jamira’s experience could not be identified.

Here’s a second response, this time focused on new ideas for other projects you or other students in your FFA could undertake that would help them develop STEAM skills too - even ones you don’t have!

Second Response from ChatGPT-4

Certainly! Here’s a table outlining potential tasks that Jamira could undertake using the MARSfarm Minis, aligned with various aspects of STEAM education. The tasks are designed to be compatible with the MARSfarm Minis’ capabilities, including manual data entry for pH, EC, and water added, as well as phenotypic observations.

Name Description of Task for Students Science Technology Engineering Arts (Agriculture) Mathematics
pH Level Monitoring Manually measure and record the pH levels of the nutrient solution in the MARSfarm Minis. Understand the importance of pH levels in plant growth. Add a new tab in the Google Sheet linked to the MARSfarm Minis to record pH data. Analyze pH data to identify trends or anomalies.
EC Level Tracking Manually measure and record the Electrical Conductivity (EC) of the nutrient solution. Learn about the role of EC in nutrient absorption by plants. Utilize Google Sheets for data entry and tracking. Use statistical methods to analyze daily EC data.
Community Data Sharing Create a new topic on the MARSfarm forums to collaborate with other schools. Create a new topic under “Experiments” or “Education” on the MARSfarm forums, asking other schools to share their raw data for comparative analysis.
3D Printed Accessories Design and 3D print accessories that could enhance the functionality of the MARSfarm Minis. Use CAD software to design accessories, referencing the “3D Printing at MARSfarm” forum topic.
Phenotypic Observations Manually record observations about plant phenotype such as leaf color, size, etc. Understand how phenotype is influenced by various growth conditions. Add a new tab in the Google Sheet for phenotypic data entry. Analyze phenotypic data to draw conclusions.
Basic Data Analysis Use raw sensor data for lessons about basic data analysis. Reference the “Software - Website & Charting” forum topic to learn how to analyze raw sensor data using Excel for basic data analysis.

Note: Cells are left empty where specific examples could not be identified. These tasks aim to provide Jamira with a comprehensive STEAM experience while making the most of the MARSfarm Minis’ capabilities.

2 Likes

The broccoli plants are doing extremely well! It has been a little over a month since planting date, and while they haven’t produced any broccoli yet they are staring to grow very fast!!! In a matter of 10 days they went from looking like this.

To looking like this.

Everyday I collect data, make sure the plants have enough water, and add fertilizer when it is time to do so. One thing that I have found extremely cool is our updated data collection process. In the beginning we were using paper to collect data and then transferring it over to an excel spread sheet, but my FFA advisor/Ag Teacher @regina.smart found a way around this. She created a Microsoft form that you fill in with the data. So it has a space to put what the pH is, the temp, and asked questions like “Did you add fertilizer, and if so how much?”. All of the numbers, data and answers go directly into an excel spread sheet without having to do it manually. I found this to be very efficient and it saves so much time! We have QR codes near the units that students can use the IPads to scan so it takes them directly to the Form.


If anyone would like to know how this was done @regina.smart is the person to ask!!!

3 Likes

Handwritten records are important, especially if there is a loss of the digital data.

In the classroom, it is important to incorporate as much technology use as possible not only to engage the students but to also have them develop skills in the use of technology which will be a needed skill in the future.

I am not very tech savvy I must admit. I am very old school, but I work hard to learn and incorporate technology. Our school was able to use money for technology and I wanted to use iPads to gather data, having no idea how to implement this I knew someone would be able to help me. I reached out to our school district tech person because no one on campus could help me do what I was envisioning. The solution was embedding a Microsoft “form” into an Excel spreadsheet. This was fantastic! The students are gathering the numerical data by answering a series of questions. This makes it easy for students to follow and ensures the data is in the proper place in the spreadsheet. This spreadsheet may then be used to analyze data. I also enjoy making the Forms nice to look at (broccoli picture).

I am also using the same format for students to gather data on our vermicomposting center, aquaculture, and hydroponics systems.

2 Likes

While going through an ACT boot camp I learned that a good majority of the Science portion of the test is interpreting graphs

When students better understand how to interpret graphs, they would do a lot better on the Science portion of the ACT. Below I have some examples given to us.

Another great resource to use is the MARSfarm interface. There are countless graphs extremely similar to this one. The MARSfarm units are constantly collecting data. Not only can you use this data for experiments and research, but you can also take the opportunity to help your students better read and comprehend the graphs.

Being able to grow food in the units is obviously the primary reason, but it doesn’t have to be the only. Using the interface to help your students not only grow plants and conduct research, but also to improve ACT scores!!!

2 Likes

@Jamira @regina.smart

I thought about your microgreens experiment, when I saw this research paper about radish microgreens in space.

The researchers in this study are a group of scientists from various institutions in Italy, including the Italian National Agency for New Technologies, Energy and Sustainable Economic Development (ENEA), the Politecnico of Milano, and the Italian Space Agency. They collaborated to understand how to grow radish microgreens in space efficiently, focusing on optimizing the light conditions for the best growth and nutritional content.

Research Significance

The careful selection of radish microgreens cultivars and the innovative approach to measuring plant health and nutrient content are part of the researchers’ efforts to find sustainable ways to grow food in space. The study’s findings not only help in understanding how different LED light recipes affect plant growth and nutrition but also contribute to developing life-support systems for astronauts on long-duration missions. This research paves the way for future investigations into optimizing space agriculture to ensure astronauts have access to fresh, nutritious foods.

Types of Microgreens Grown

They focused on two cultivars of radish microgreens:

  1. Green Daikon Radish (Raphanus sativus var. longipinnatus) - Known for its spicy flavor and nutritional benefits, including vitamins, minerals, and antioxidants.
  2. Rioja Improved Radish (Raphanus sativus) - Another variety chosen for its potential nutritional benefits and adaptability to different growing conditions.

Measurement of Plant Compounds

To assess the impact of different lighting conditions on plant metabolism, the researchers used a non-destructive, fluorometric-based technique. This approach involved measuring the fluorescence emitted by the plants in response to specific wavelengths of light. The fluorescence measurements can indicate the presence and quantity of certain metabolites in the plants, such as:

  • Flavonols and Anthocyanins: These are types of phytonutrients that have antioxidant properties. The plants produce more of these compounds in response to certain stressors, including light conditions.
  • Chlorophyll: The green pigment essential for photosynthesis, indicating the health and growth efficiency of the plants.

The technology used, known as a multiparametric fluorescence sensor, allowed the team to quantify these compounds accurately without harming the plants. This method is crucial for space farming, where monitoring plant health and maximizing resource efficiency are critical.

Why should you care?

Even though you might not have access to the same tools as the researchers to measure plant compounds directly, there’s a lot you can learn and apply from this study, especially because you have access to half a dozen growth chambers with controllable LEDs.

Key Takeaways from the Research:

  1. Light Recipes Matter: The study showed that the combination of red, blue, and green LED lights significantly impacts how well radish microgreens grow and how many healthy compounds they produce. Specifically, a mix of 40% red, 40% blue, and 20% green light was found to be the best for growth and nutrient content.

  2. Different Plants, Different Needs: The research focused on two types of radish microgreens, each responding slightly differently to the light conditions. This teaches us that when you’re growing plants, it’s important to consider their specific needs and how they might respond to different environments.

How You Can Use This Research:

  1. Mimic the Light Recipe: If you have a grow light system or are planning to set one up, try to adjust the light to match the 40% red, 40% blue, and 20% green mixture. This could mean using separate LED lights for each color or finding a grow light that lets you adjust the color balance.

  2. Observe Plant Responses: Pay attention to how your plants grow under these conditions. Look for signs of healthy growth like the size of the leaves, the height of the plants, and how quickly they grow. Even without measuring the specific compounds, healthy plants usually indicate a good balance of nutrients.

  3. Experiment with Variations We could create a recipe in the MV1 to add far-red light (it has 4 far-red LEDs) to see if it affects the growth or appearance of your plants.

  4. Copy the ‘phenotypic’ metrics they use Clearly, the authors of this paper are more qualified than us at determining what is important to measure on a microgreen experiment. So rather than guessing or trying to figure this out for ourselves, it would be wise to just collect the same data (or at least some of it) that they do for some of the seedlings in your experiments.

  1. Similarly, it would be wise to copy their experimental procedures There are many substitutes for ‘felt’ (literally, you can just use felt) available from a fabric store - or online. Also probably wise to pre-soak the seeds (both for food safety, and germination optimization reasons) @Jamira on all of your experiments.

  1. Select a day/night temperature. You can reference this other paper that demonstrated several different combinations of day/night temperatures on radishes. This will vary by cultivar - as you can see in the photo below where 29C day/23C night does great for the ‘A’ variety but not ‘B’ variety. Most plants have a Q10 of 2, which means that for every 10 degree Centigrade increase in tissue temperature, the reaction rates can double (within the temperature limits of that plant). So photosynthesis rates can double between a cool morning and a hot afternoon. In reverse, respiration rates can be cut in half between a warm afternoon and a cool night. Basically, things react faster when warm, and slower when cold. So when considering what cultivars to pick for microgreens even - consider those that can be grown in warmer temperatures so that the growth rate can be maximized.

Great job connecting those dots Jamira!!