My charting of plant growth took an unexpected turn, with the values dropping off as the plants are getting bigger.
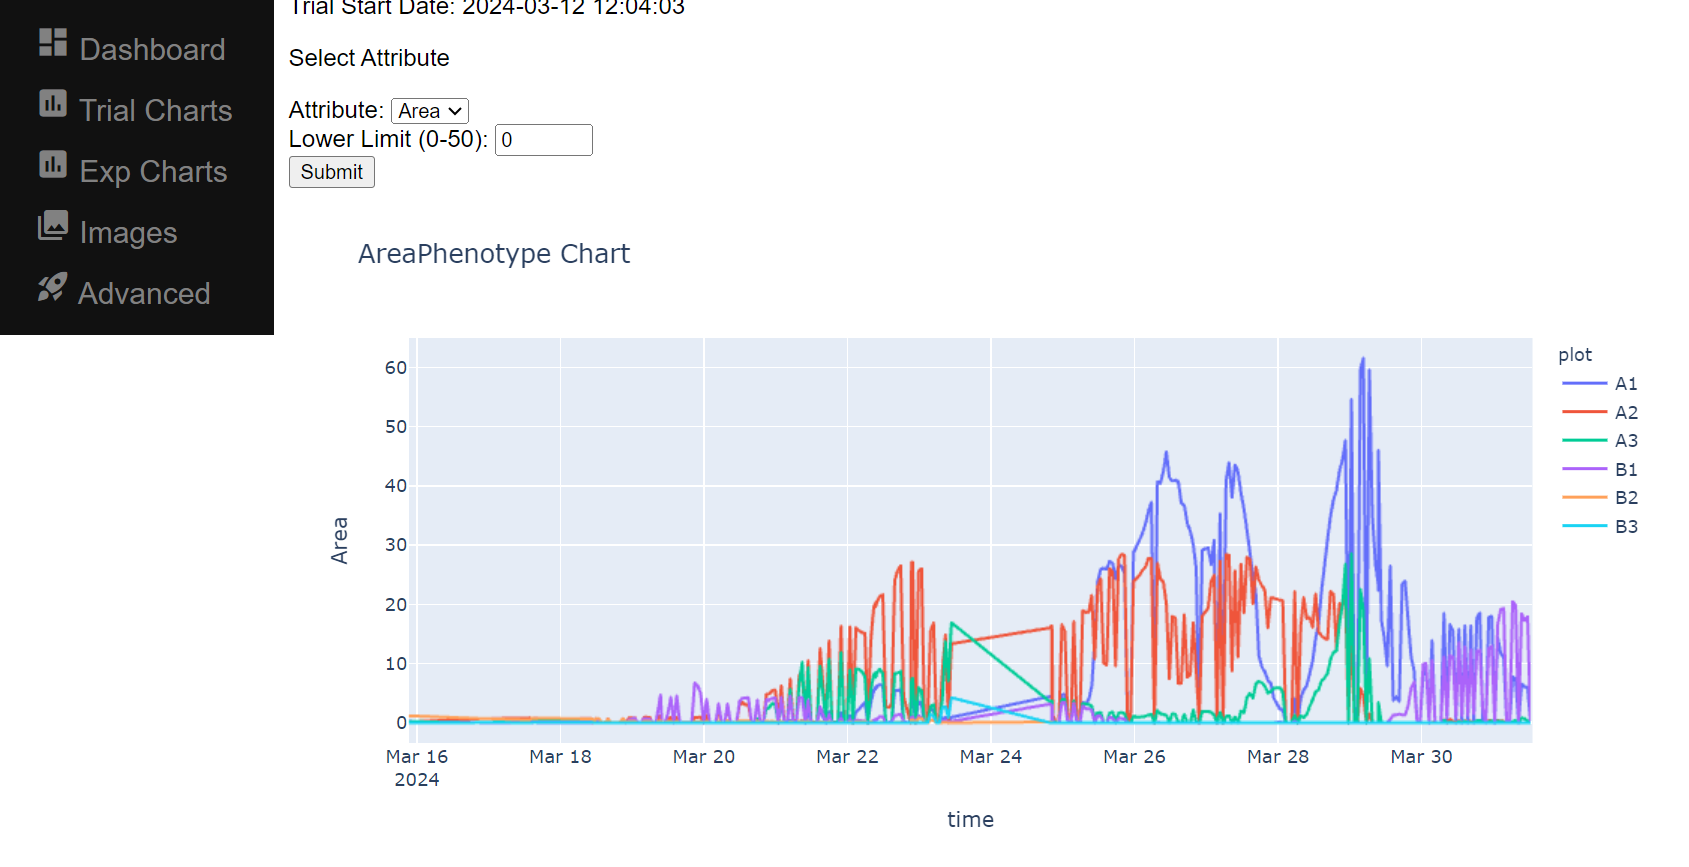
(Plot of green[255] from start of trial to present, one line per pot/plot)
Looking at the image, and the full spectrum histogram explains things:
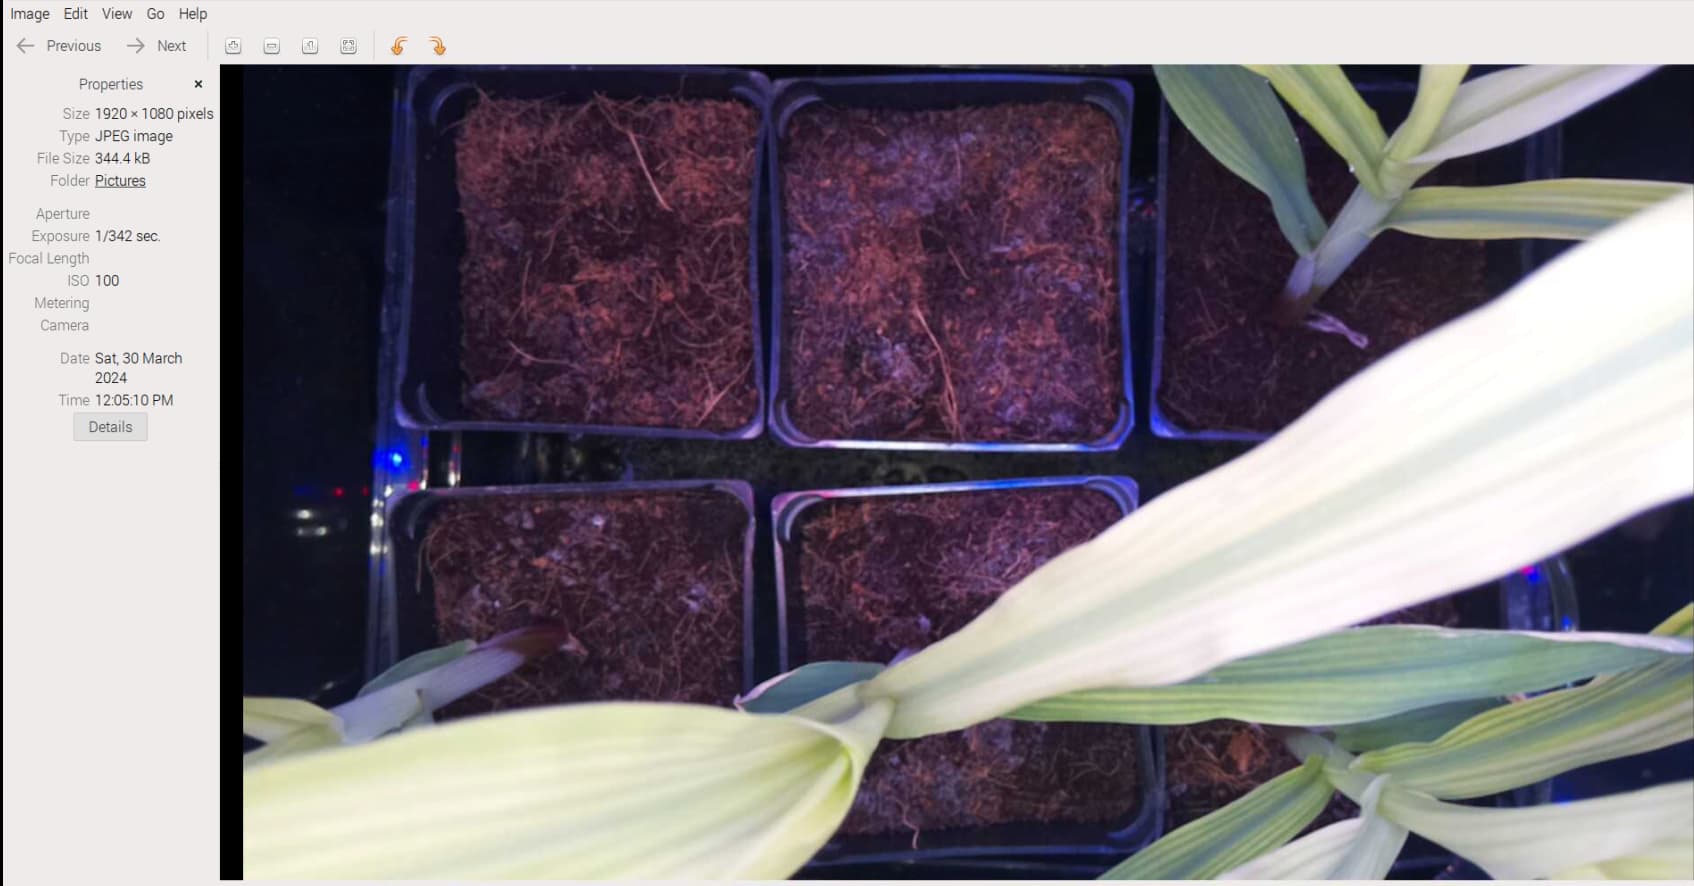
(Recent image from the MV)
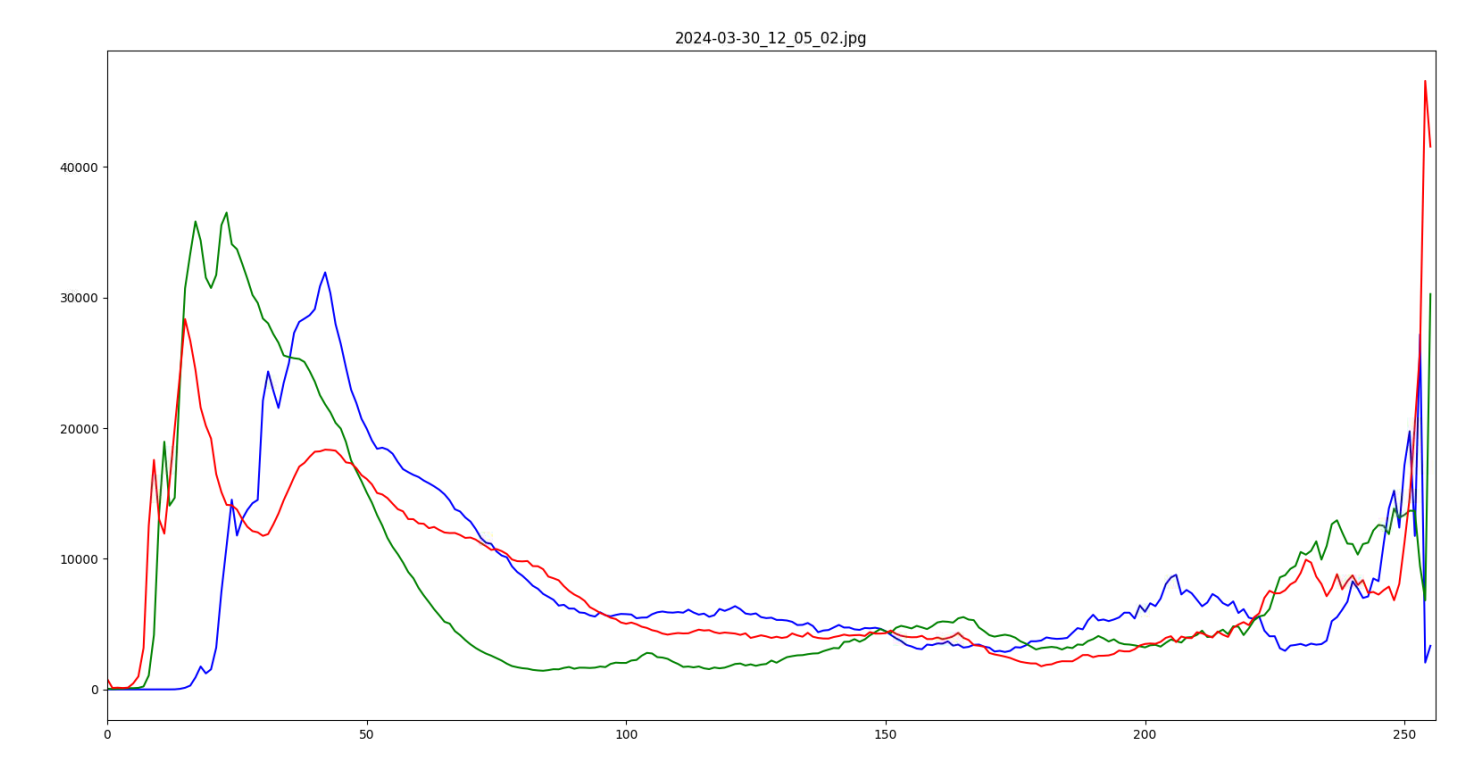
(RGB Histogram of the plant image)
The plant is not bright green, but white with green stripes, and the closer to the light it gets the more bleached the photo looks.
This is evident in the histogram, as the right shows a green spike, but blended with other colors. The colors on the left are the soil and other parts of the box - they are consistent in most of the images.
My conclusion is that while looking for the green channel for bin 255 works as a general indicator of plants being present, and catches early stage growth, you have to understand the plants, lighting and camera to correctly interpret the data. to get the full life cycle growth will still require more complicated processing, that may end up being species specific.